Research Article
Planktonic Diatoms as Bio-indicators of Ecological Integrity of Lower Ogun River, Abeokuta, Southwestern, Nigeria 
2 Department of Aquaculture and Fisheries Management, Federal University of Agriculture, PMB 2240, Abeokuta, Nigeria
 Author
  Correspondence author
International Journal of Aquaculture, 2018, Vol. 8, No. 26
Received: 18 Jul., 2018 Accepted: 15 Oct., 2018 Published: 26 Oct., 2018
The application of biological indicators is a cheaper alternative for quality assessment of surface waters and can be used to complement routine physical/chemical analysis. This study evaluated the ecological integrity of Lower Ogun River using planktonic diatoms. Water and planktonic diatom samples were collected from four sampling stations fortnightly for a period of four consecutive months (March-June, 2015). Water quality parameters including pH, temperature, electrical conductivity, total dissolved solids, dissolved oxygen, chemical oxygen demand, nitrite, nitrate, ammonium, phosphate, sulphide, chloride, iron, manganese, silicate, total alkalinity, total hardness, total suspended solids, transparency and total organic carbon were analyzed using standard methods. Planktonic diatom samples were collected using 55 µm standard hand plankton net and analyzed following standard protocols. Data collected were subjected to descriptive and inferential statistics using PAST and SPSS statistical packages. A total of 54 planktonic diatoms belonging to 11 orders and 3 classes were identified at the study sites with Melosira varians having the highest abundance (3860 individuals/ml). The dominance of Melosira varians was indicative of organic pollution. The ranges of community structure indices were as follows: Shannon-Weaver Index (2.58-3.53), Menhinick index (0.23-0.57), Margalef index (0.97-3.85), Pielou index (0.70-0.96) and Simpson’s dominance index (1.03-1.41). Canonical Correspondence Analysis and Pearson Correlation results showed correlation between physical/chemical parameters, planktonic-diatom abundance, species composition, distribution and community structure at different levels of significance (p<0.05). It was concluded that the quality of the river during the study period ranged between no pollution and slight/moderate pollution.
Background
Phytoplankton have been widely used as bioindicators of water quality in Nigerian waters (Kadiri, 2007; Olele and Ekelemu, 2008; Ajani, 2010; Ojo, 2011; Kadiri, 2011; Dimowo, 2013; Onyema, 2013). This is because they serve as a source of important information on the state and functioning of river ecosystems (Kelly et al., 2008). Planktonic diatoms occur free-living in the water column of rivers and dams (Taylor, 2004). They are single celled autotrophic organisms with highly ornate siliceous walls which are a major component of plankton (free-floating microorganisms) in nearly every freshwater and marine habitat. (Theriot, 2012; UCMP, 2015). They are often the most important group of phytoplankton, both in terms of biomass and species composition (Lemke and Zgrundo, 2009). Diatoms account for no more than 25-30% of primary production in nutrient-poor waters and by estimation 75% in nutrient-rich regions (Nelson et al., 1995; Mann, 2010).
Literatures exist in other countries across the globe on water quality assessment using the combination of physical/chemical parameters and diatoms as indicators. Matlala et al. (2008) investigated the use of diatoms to indicate the quality of water in wetlands in South Africa. Mackay et al. (2011) investigated the sensitivity of diatom to hydrological and nutrient variability in a subtropical, flood-pulse wetland. Kireta et al. (2011) investigated the use of planktonic and periphytic diatom assemblages as potential biological indicators of ecological conditions in the Ohio, Missouri and Upper Mississippi rivers. Martin and Fernandez (2012) discussed the procedure in the use of diatoms as indicators of water quality and ecological status. Elias et al. (2012) undertook a study to determine whether season influences the ecological quality assessment of streams on the basis of diatoms. Bhattacharya (2012) investigated the use of diatoms to infer environmental change of the lower White River, southeastern Arkansas. Hosmani (2012) assessed water quality of Kabini River, Southern India using freshwater diatoms as indicators. Tan et al. (2013) carried out water quality assessment of upper Han River, a subtropical river in China using diatom indices. Kavya and Savitha (2014) investigated the use of bacillariophyceae as ecological indicators of water quality in two lakes of Mysore.
Not much freshwater quality assessment specifically using diatoms as indicator species has however been carried out in Nigeria. Most of the studies in Nigeria have been investigated on the species composition, abundance, diversity and community structure of phytoplankton. In Nigeria, diatoms have been reported as the major component of plankton in various water bodies such as Ogun River (Ojo, 2011; Dimowo, 2013; Onyema et al., 2014); Awon Reservoir (Akinyemi and Sodamade, 2015); Ogun Coastal Water (Ojelade et al., 2016) and Lower Sombreiro River (Wokoma et al., 2016). Their species composition have also been investigated in water bodies not limited to: Imo River Estuary (Akoma and Opute, 2011); Ologe Lagoon (Onuoha et al., 2010); Lekki Lagoon (Adesalu and Nwankwo, 2009); Lagos Lagoon (Ajani, 2010); Five-Cowrie Creek (Onyema et al., 2006); New Calabar River (Erondu and Chindah, 1991); Saminaka Reservoir (Tanimu et al., 2011). However, only few studies which include Kadiri (2003), Akinyemi et al. (2007) have been carried out with emphasis on diatoms in Nigeria.
Recent studies have shown the advantage of specifically using diatoms as against the whole microflora in water quality assessment/monitoring. Kelly et al. (2006) as cited by Kelly et al. (2008) reported that the advantage the use of diatoms has over the use of the whole microflora includes that: High organic components of sample matrix are removed through the use of oxidizing agents, once prepared, slides can be kept and referred to for many years. They have a smaller range of size and magnification of 1000× mostly suitable in analysis.
Diatoms also possess a number of attributes which contribute to their suitability as biological indicators. They are highly favoured due to the specific water quality tolerance each species portend (Lobo et al., 2004; Harding, 2005; Dela-cruz et al., 2006). They are highly sensitive to water chemistry changes, abundant in aquatic environments, largely cosmopolitan in distribution, less habitat dependent than macro-invertebrates and have a well-studied taxonomy and ecology (Reid et al., 1995). The abundance and species of diatoms are influenced strongly by nitrogen and phosphorus concentration/ratio in the water (Wang et al., 2014). Diatom community structures can be used to study current water quality as well as historical conditions (Taylor et al., 2005; Matlala et al., 2008). More so, the use of diatoms in water quality assessment is cheaper than routine chemical analyses and directly shows the impact of pollution on the aquatic biota (Taylor et al., 2005). This signifies that diatoms could play important roles in monitoring programmes (Lemke and Zgrundo, 2009).
In contrast to its beneficial uses, a few species of diatoms have been shown to form harmful algal bloom (HAB) which causes negative impacts on the aquatic environment and damage to other organisms through the production of toxins (Kadiri, 2010). Various studies as reported by Kadiri (2010) have shown that the consumption of toxin-contaminated food by humans can lead to grave health fatalities manifested in symptoms such as death, allergy, dermatological, respiratory, cardiovascular problems, liver damage, gastrointestinal and neurological disorders typified by headache, diarrhoea, vomiting, abdominal pains, seizures, short term amnesia, sweating, paralysis and coma (Van Dolah, 2000; Kadiri, 2010).
Since Ogun River is susceptible to pollution with the many developmental and industrial activities carried out with close proximity to its bank, there was the need to mitigate water quality problems that could emanate from these activities by regular water quality monitoring and surveillance. More so, the tolerance of diatom species to water quality parameters and their co-relationship in Nigerian water bodies are poorly understood. This was the basis for evaluating the ecological integrity of Lower Ogun River using planktonic diatoms as bio-indicators.
1 Materials and Methods
1.1 Description of the study area
Abeokuta is the capital and the largest city in Ogun State which is situated in the southwestern part of Nigeria (NBS, 2012). Soils in Abeokuta have been characterized as being sandy, formed from sedimentary rocks and can only support savannah vegetation. Vegetation is predominated by guinea and derived savannah (Online Nigeria, 2016). Ogun River (Figure 1) is one of the main rivers in the southwestern part of Nigeria with a total area of 22.4 km2 and a fairly large flow of about 393 m3/sec during the wet season (Oketola et al., 2006). It has coordinates of 3°28’’E and 8°41’’N from its source in Oyo State to 3°25’’E and 6°35’’N in Lagos where it enters the Lagos lagoon (Ayoade et al., 2004). Mean annual rainfall ranges from 900 mm in the north to 2,000 mm towards the south. The estimates of total annual potential evapo-transpiration have been put between 1,600 mm and 1,900 mm (Bhattacharya and Bolaji, 2010). Ogun River water is used for agriculture, transportation, human consumption, various industrial activities and domestic purposes (Ayoade et al., 2004; Oketola et al., 2006). It also serves as a raw material to the Ogun State Water Corporation which treats it before dispensing it to the public. Along its course, it constantly receives effluents from breweries, slaughterhouses, dyeing industries, tanneries and domestic wastewater before finally discharging to Lagos lagoon (Ayoade et al., 2004; Oketola et al., 2006).
|
Figure 1 Map of Lower Ogun River, Abeokuta showing the sampling stations |
.png)
1.2 Past studies on the water quality of Lower Ogun River at Abeokuta
The water quality of Lower Ogun River has been studied for over 30 years (Adebisi, 1981; Martins, 1987). Several studies have been carried out on Lower Ogun River at Abeokuta. Among such studies include: Adeogun et al. (2011), Awoyemi (2012), Ikotun et al. (2012), Osunkiyesi (2012), Dimowo (2013), Olayinka et al. (2013), Adeosun et al. (2014), Ojekunle et al. (2014), and Taiwo et al. (2014). A summary of the range of values of physical and chemical parameters reported by these scientists is presented (Table 1).
|
Table 1 Ranges of the water quality parameters of Lower Ogun River at Abeokuta Note: W-T = Water temperature; pH = Hydrogen ion concentration; COND = Electrical Conductivity; TDS = Total Dissolved Solids; TRANS = Water Transparency; Fe+ = Iron; NO2- = Nitrite; NO3- = Nitrate; Mn+ = Manganese; SiO3- = Silicate; PO4 = Phosphates; Cl- = Chloride; TA = Total Alkalinity; TH = Total Hardness; COD = Chemical Oxygen Demand; TSS = Total Suspended Solids; DO = Dissolved Oxygen |
.png)
1.3 Water sampling and analysis procedure
Water samples were collected into well labeled sample bottles fortnightly for the period of four months (March-June, 2015) from four sampling stations along the river. Station A was located close to the Ogun State Water Works Corporation, Arakanga, Ibẹrẹkodo; Station B was located close to the FADAMA III supported ferry at Agọ-ika; Station C was located just below the bridge connecting to Lafenwa at Ẹnu gada; and Station D was located just down the road off Pepsi bus stop, Quarry road. The physical and chemical parameters determined included pH, water temperature, electrical conductivity and total dissolved solids which were determined in-situ with the use of HANNA Hi 98129 multi meter while dissolved oxygen, chemical oxygen demand, nitrite, nitrate, ammonium, phosphate, sulphide, chloride, iron, manganese, silicate, total alkalinity, hardness, total suspended solids and total organic carbon were determined in the laboratory using standard methods (Merck, 2014). Water transparency was also measured in-situ using Secchi disc. The specific procedures followed and results are presented in Article 5.
1.4 Planktonic diatom sampling and analysis procedure
Diatom samples were collected fortnightly from four sampling stations along the river for the period of four months (March-June, 2015). Diatoms were sampled using 55 µm mesh size standard hand plankton net by trawling horizontally 10 times and filling into air tight 120 mL well labeled plastic bottles. Preservation of the samples with 4% neutral formalin was carried out within 5 minutes of collection to prevent the silica cell walls of the diatoms from cracking. This method was adapted from Dimowo (2013). Thereafter, in the laboratory, the samples were mounted on microscope slides by first shaking the samples vigorously and then pipetting a drop onto the slides with the use of a dropper. The identification of the diatoms was done to the lowest taxonomic category possible under the microscope using keys of identification (such as Edmondson, 1959; Gell et al., 1999; Biggs and Kilroy, 2000; Janse et al., 2006). Then enumeration was carried out using the drop count method adapted from Dhargalkar and Ingole (2004). The abundance of organisms in each sample was extrapolated from the number of organisms per drop to the number of organisms per ml by multiplying the number of organisms per drop by 20 based on the tested premise that 20 drops of the sample make 1 mL.
1.5 Data analysis
Descriptive statistics in the form of frequency tables, range and percentages were used in the presentation of the data. Inferential statistics such as community structure analyses viz. Margalef Species Richness Index, Shannon and Weaver diversity index etc., correlation analysis and canonical correspondence analysis were carried out. For the purpose of this research, MS EXCEL (Microsoft Corporation, 2006), SPSS 20.0 (IBM Corporation, 2011) and PAST 2.17c (Hammer et al., 2001) Statistical Packages were employed.
1.6 Community structure analysis
This was calculated using manually inputted formulas in MS EXCEL spreadsheets. Different methods were used to determine the community structure of diatoms namely:
Margalef Species Richness Index (Ogbeibu, 2005). It is given by:
.png)
Where: d=Species richness index; S=Number of species in a population; N=Total number of individuals in S species.
Shannon-Weaver diversity index (Shannon and Weaver, 1949). It is given by:
.png)
Where: Hs = Shannon-Weaver Diversity Index; N = Total number of individuals in S species; i = Counts denoting the ith species ranging from 1-n; Pi = Proportion that the ith species represents in terms of numbers of individuals with respect to the total number of individuals in the sampling space as whole.
Pielou Species Equitability or Evenness Index (Pielou, 1966). It is given by:
.png)
Where: j = Equitability Index; Hs = Shannon-Weaver Index; S = Number of species in a population.
Simpsons Dominance Index (Simpson, 1949). It is given by:
.png)
Where: C = Simpsons Dominance Index; N = Total number of organisms of all species; ni = Total number of organisms of a particular species.
Menhinick’s Index (Ogbeibu, 2005). it is given by:
.png)
Where: D=Menhinick’s Index; S=Number of species in a population; N=Total number of individuals in S species.
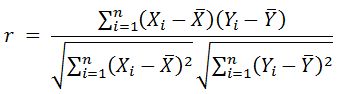
1.7 Correlation analysis
Bivariate Correlation Analysis was carried out using Pearson’s Product-Moment Coefficient of Correlation in SPSS to check for the relationship between the physical and chemical parameters and diatom species abundance and diversity spatiotemporally. The physical and chemical parameters (except pH) and diatom abundance data were log transformed before analysis in order to achieve normal distribution. Pearson’s Product Moment Coefficient of Correlation formula is given as:
1.8 Canonical correspondence analysis (CCA)
This was carried out using PAST to determine the relationship between spatial distributions of diatoms with water chemistry. All the parameters except pH and the relative abundances of diatom species in each of the sampled habitats were log transformed before analysis in order to achieve normal distribution.
2 Results
2.1 Physical, chemical parameters, species composition, abundance, distribution and community structure of planktonic diatoms in Lower Ogun River at Abeokuta
The weekly and monthly spatial variations in the physical, chemical parameters, abundance of planktonic diatoms, the weekly percentage distribution of planktonic diatom classes and the weekly variation in the community structure indices of planktonic diatoms in Lower Ogun River at Abeokuta are available as supplementary files.
The range of values of physical/chemical parameters (Table 1) with the exception of pH and total hardness compared well with those of previous studies (Adeogun et al., 2011; Awoyemi, 2012; Dimowo, 2013; Ikotun et al., 2012; Osunkiyesi, 2012; Olayinka et al., 2013; Adeosun et al., 2014; Ojekunle et al., 2014; Taiwo et al., 2014). In this study, total hardness was much lower while pH was relatively higher than the range of values reported by previous studies.
A total of 54 planktonic diatoms (Table 2) belonging to 11 orders and 3 classes were identified in the study sites. Melosira varians (3860) had the highest relative abundance (Figure 2) closely followed by Coscinodiscus rothii (3320) and Synedra ulna (2360).
|
Table 2 Checklist of planktonic diatoms of Lower Ogun River at Abeokuta |
.png)
|
Figure 2 Most abundant planktonic diatom species in Lower Ogun River at Abeokuta |
.png)
The monthly spatial percentage distribution of planktonic diatom classes (Figure 3) was in the following order: Coscinodiscophyceae dominated the assemblage in Stations A, B (March), Station B (April), Stations A, B, C (May) and Stations A, C, D (June) while Fragillariophyceae dominated in Station D (March) and Bacillariophyceae dominated the assemblage in Station C (March), Stations A, C, D (April), Station D (May) and Station B (June). The overall percentage distribution of planktonic diatom classes (Figure 4) was in the following order: Coscinodiscophyceae > Bacillariophyceae > Fragillariophyceae. In terms of division, the pennates dominated the planktonic diatoms (55%). The overall percentage distribution of planktonic diatom orders (Figure 5) was in the following order: Thalassiosirales > Centrales/Melosirales > Fragilariales > Naviculales > Eunotiales > Surirellales > Cymbellales = Achnanthales = Rhopalodiales > Bacillariales > Thalassiophysales > Tabellariales.
|
Figure 3 Monthly spatial percentage distribution of planktonic diatom classes in Lower Ogun River at Abeokuta |
.png)
|
Figure 4 Overall percentage distribution of planktonic diatom classes in selected parts of Lower Ogun River at Abeokuta |
.png)
|
Figure 5 Overall percentage distribution of planktonic diatom orders in selected parts of Lower Ogun River at Abeokuta |
.png)
The monthly spatial variation in the community structure indices (Table 3) was in the following order: Abundance was highest (3420) in Station C (May) and lowest (400) in Station A (June). Species diversity was highest (32) in Station A (April) and lowest (7) in Station B (March). Shannon-Weaver Index was highest (3.53) in Station C (May) and lowest (2.58) in Station A (June). Menhinick Index was highest (0.57) in Station A (April) and lowest (0.23) in Station D (March). Margalef Index (3.85) was highest in Station A (April) and lowest (0.97) in Station B (March). Pielou Equitability Index was highest (0.96) in Stations B and D (March) but lowest (0.70) in Station A (April). Simpsons Dominance Index was highest (1.41) in Station C (June) and lowest (1.03) in Stations A and C (May).
|
Table 3 Monthly spatial variation in the community structure indices of planktonic diatoms in selected parts of Lower Ogun River in Abeokuta |
.png)
2.2 Relationship between physical, chemical parameters, planktonic diatom abundance and community structure indices of Lower Ogun River at Abeokuta
The relationship between physical, chemical parameters, planktonic diatom abundance and community structure indices (Table 4) is as follows: Coscinodiscophyceae abundance was positively correlated with hydrogen ion concentration (Pearson Correlation: p<0.05), water transparency (p<0.05). Total abundance (p<0.01), species diversity (p<0.05) and Shannon-Weaver index (p<0.01). Fragillariophyceae abundance was positively correlated with ammonium (p<0.05), total alkalinity (p<0.05), species diversity (p<0.05) and Margalef index (p<0.05). Bacillariophyceae abundance was positively correlated with total abundance (p<0.01), species diversity (p<0.01), Shannon-Weaver index (p<0.01), Menhinick index (p<0.05), Margalef index (p<0.01), and negatively correlated with Pielou index (p<0.01) and Simpsons dominance index (p<0.01). Total abundance was positively correlated with coscinodiscophyceae abundance (p<0.05), bacillariophyceae abundance, species diversity, Shannon-Weaver index (p<0.05), Margalef index (p<0.01). Species diversity was positively correlated with water temperature (p<0.05), hydrogen ion concentration (p<0.05), phosphates (p<0.05), coscinodiscophyceae abundance (p<0.05), fragillariophyceae abundance (p<0.05), bacillariophyceae abundance (p<0.01), total abundance (p<0.01), Shannon-Weaver index (p<0.01), Menhinick index (p<0.01), Margalef index (p<0.01), Pielou index (p<0.01) and Simpsons dominance index (p<0.01). Shannon-Weaver index was positively correlated with coscinodiscophyceae abundance (p<0.01), bacillariophyceae abundance (p<0.01), total abundance (p<0.01), species diversity (p<0.01) and Margalef index (p<0.01). Menhinick index was positively correlated with bacillariophyceae abundance (p<0.05), species diversity (p<0.01), Margalef index (p<0.01) and negatively correlated with Pielou index (p<0.01), and Simpsons dominance index (p<0.01). Margalef index was positively correlated with water temperature (p<0.05), hydrogen ion concentration (p<0.05), fragillariophyceae abundance (p<0.05), bacillariophyceae abundance (p<0.01), total abundance (p<0.01), species diversity (p<0.01), Shannon-Weaver index (p<0.01), Menhinick index (p<0.01) and negatively correlated with Pielou index (p<0.01), and Simpsons dominance index (p<0.01). Pielou index was negatively correlated with water temperature (p<0.05), phosphates (p<0.05), bacillariophyceae abundance (p<0.01), species diversity (p<0.01), Menhinick index (p<0.01), Margalef index (p<0.01), and positively correlated with Simpsons dominance index. Simpson’s dominance index was negatively correlated with total alkalinity, total suspended solids, bacillariophyceae abundance, species diversity, Menhinick index, Margalef index and positively correlated with Pielou index.
|
Table 4 Pearson correlation coefficients of physical and chemical parameters, planktonic diatom abundance and community structure indices of Lower Ogun River at Abeokuta Note: *: Correlation is significant at the 0.05 level (2-tailed); **: Correlation is significant at the 0.01 level (2-tailed). Where LogWT = Log Water temperature; pH = Hydrogen ion concentration; LogCOND = Log Electrical conductivity; LogTDS = Log Total dissolved solids; LogTRANS = Log Water transparency; LogFe = Log Iron; LogNO2 = Log Nitrite; LogNO3 = Log Nitrate; LogMn = Log Manganese; Log NH4 = Log Ammonium; LogSO3 = Log Sulphide; LogSiO3 = Log Silicate; LogPO4 = Log Phosphate; LogTA = Log Total alkalinity; LogTOC = Log Total organic carbon; LogTH = Log Total hardness; LogCOD = Log Chemical oxygen demand; LogTSS = Log Total suspended solids; LogDO = Log Dissolved oxygen; LogCN = Log Coscinodiscophyceae abundance; LogFN = Log Fragilariophyceae abundance; LogBN = Log Bacillariophyceae abundance; LogTN = Log Total abundance; LogS = Log Species diversity; Hs = Shannon-Weaver Index; D = Menhinick Index; d = Margalef Index; j = Pielou Equitability Index; C = Simpsons Dominance Index |
.png)
2.3 Relationship between the physical, chemical parameters and species distribution of planktonic diatoms of Lower Ogun River at Abeokuta
The Canonical Correspondence Analysis (CCA) plot (Figure 6; Figure 7) showed that sulphide, nitrate and manganese were positively and negatively correlated to Axis 1 and 2 respectively. Water transparency, iron, phosphate, water temperature and nitrite were positively correlated with both axes while dissolved oxygen, total organic carbon, chloride, ammonium, total alkalinity and total suspended solids were negatively correlated with both axes. Chemical oxygen demand, silicate, total hardness, total dissolved solids and electrical conductivity were negatively and positively correlated to Axis 1 and 2 respectively.
|
Figure 6 Canonical correspondence analysis biplot showing environmental variables and planktonic diatom species scores |
.png)
|
Figure 7 Canonical correspondence analysis biplot showing environmental variables and planktonic diatom sample scores; Colour connotation: Black-Station A; Red-Station B; Blue-Station C; Green-Station D |
.png)
The species tolerant of manganese (Figure 6) was Fragilaria crotonensis. Also, Stauroneis cf. kriegerii and Gomphonema accuminatum were tolerant of nitrate, while Gyrosigma attenuatum, Epithemia solea, Epithemia adnata, Cymbella tumida and Gomphonema accuminatum were tolerant of sulphide. However, Gomphonema accuminatum was tolerant of pH. Caloneis bacillum, Synedra ulna and Melosira varians were tolerant of water transparency. However, Campylodiscus clypeus, Cymatopleura solea, Amphiprora alata, Planothidium lanceolatum, Denticula subtilis and Aulacoseira granulata were tolerant of water temperature while Campylodiscus clypeus, Frustulia vulgaris, Eunotia formica and Cyclotella meneghiniana were tolerant of phosphates. Frustulia vulgaris, Diatoma hiemale, Nitzchia cf. acicularis and Gomphonema parvulum were tolerant of iron while Navicula spp was tolerant of silicate, total hardness, total dissolved solids and electrical conductivity. Synedra ulna, Pinnularia interrupta and Amphicampa erura were tolerant of dissolved oxygen while Cyclostephanos dubius, Amphicampa erura and Synedra acus were tolerant of total organic carbon and chloride. Pinnularia interrupta was also tolerant of total organic carbon. Finally, Cocconeis placentula, Amphicampa erura and Synedra acus were tolerant of ammonium while Pinnularia interrupta was tolerant of total alkalinity and total suspended solids.
In the stations (Figure 7), the physical and chemical parameters that influenced the distribution of planktonic diatom species were characterized as follows: Station A: water transparency, nitrite, pH, chemical oxygen demand, manganese; Station B: pH; Station C: manganese, total hardness, nitrate; Station D: nitrate, total hardness and total alkalinity.
3 Discussion
The concurrent lowness of total hardness concentration and highness in the pH value must have been brought about by the pollution of the river water body with textile effluents rich in sodium hydroxide (NaOH). This is because sodium hydroxide has the potency to increase pH but cannot increase the total hardness concentration whose principal causing ions are Calcium and/or Magnesium (EPA, 2001). The low level of total alkalinity (< 20 mg/L) in this study was an indication of lack of the ability of the river water body to prevent fluctuations in pH. It can be elucidated that the river water body is lacking in calcium carbonates and/or bicarbonates despite having a rocky bottom.
Melosira varians has been reported to be common in freshwater habitats especially eutrophic (Kelly et al., 2005). It has also been reported as an indicator of high trophic level that frequently develops in masses (Picinska-Faltynowicz and Blachuta, 2009). The dominance of Melosira varians in this study was suggestive of excessive enrichment of the river water with nutrients. Akinyemi et al. (2007) in their study of diatoms as indicators of pollution in Awon reservoir, Nigeria reported Pinnularia lata, P. mesolepta, Navicula rhychocephala, Aulacoseira granulata and Amphora as the predominant diatom species to indicate pollution.
Water bodies with Shannon-Weaver Index >3 have been shown to be with no contaminant, 1-3 contain moderate contaminants and < 1 indicates high pollution level (Salusso and Morana, 2002; Rejeki et al., 2012). Another classification by Wilhm and Dorris (1968) as cited by Weng and Beh (2015) stated that the value of the Shannon-Weaver diversity index with value lower than 1.0 is considered highly polluted; 1.0 to 3.0 as slightly polluted and higher than 4.0 is not contaminated.
Following these classifications, the range of values of Shannon-Weaver Index (2.58-3.53) showed that the water quality of the river during the study period ranged between no pollution and slightly/moderately polluted. There was variation in diversity during the study period as shown by Menhinick and Margalef index.
The range of values of the Pielou equitability index was generally very high (0.70-0.96). This signified that the species diversity across the stations was evenly distributed. According to Zimmerman (1993), pollution of a stream reduces the number of species of the system (i.e., Species Diversity), while frequently creating an environment that is favorable to a few species (i.e., pollution-tolerant forms). Thus, in a polluted stream, there are usually large numbers of a few species, while in a clean stream there are moderate numbers of many species (Zimmerman, 1993).
Simpson index is always higher where the community is dominated by less number of species and when the dominance is shared by large number of species (Whittaker, 1965; Shah and Pandit, 2013). Simpson’s index (1.03-1.41) in this study showed that the community structure of planktonic diatoms was mature, stable and shared by large number of species. This was in agreement with the observations of Dash (2003) that mature and stable communities have high diversity value, while the communities under stress conditions, exhibiting low diversity, usually show close to zero value. This result was also in agreement with the inference from the Pielou index.
The diatom community structure of this present study did not correlate with electrical conductivity, total dissolved solids, water transparency, total organic carbon, total hardness, chemical oxygen demand and concentrations of iron, nitrate, nitrite, manganese, sulphide, silicate and dissolved oxygen.
The correlationship observed between pH and coscinodiscophyceae abundance, species diversity and Margalef index corroborated the observations of Chattová et al. (2009) who reported that diatom species richness was influenced mainly by pH. However, the lack of significant correlation between diatom community structure and concentration of nitrate was not in line with the inference of Chattová et al. (2009) that nitrate is one of the environmental factors that affect species structure.
The positive correlation observed between ammonium and fragillariophyceae abundance corroborated the findings of Cibic et al. (2009), who reported that the highest richness and diversity were observed at sites in the Gulf of Trieste characterised by NH4+ enrichment leading to the highest dominance. However the negative correlation observed between phosphate and species diversity in this present study was not in line with Cibic et al. (2009).
This correlationship observed between diatom community structure and water temperature, pH, water transparency, ammonium, phosphate, total alkalinity, total suspended solids in this present study agreed with the inference of Matlala et al. (2008) who stated that diatom community structure are dictated by prevailing physical and chemical parameters and the structure of these communities can be used to infer water quality.
The assemblage of planktonic diatoms in this study were influenced by the following physical/chemical parameters: manganese, nitrate, sulphide, pH, water transparency, water temperature, phosphates, iron, silicate, total hardness, total dissolved solids, electrical conductivity, dissolved oxygen, total organic carbon, chloride, ammonium, total alkalinity and total suspended solids.
These results tallied with the observations of Zgrundo et al. (2009) that water salinity, phosphates and silicates were among the most significant variable for the existence and growth of studied diatom assemblages.
The tolerance of diatom species in this study such as Fragilaria crotonensis, Frustulia vulgaris, Diatoma hiemale, Nitzchia cf. acicularis and Gomphonema parvulum to manganese and iron in this study agreed with the observations of Ferreira et al. (2009) and Wang et al. (2014) that heavy metal pollution can influence diatom survival and growth.
This result confirmed the inference of Birkett and Gardiner (2014) that a relationship does exist between diatom assemblages and environmental quality, and that monitoring these communities can provide a more precise indication of water quality than mere traditional monitoring approaches. This result agreed with Zolan (1981), Sabanci (2011) and was comparable with Kivrak and Uygun (2012) and Blanco et al. (2013) who reported similar results. The results of this study also agreed with Matlala et al. (2008) who inferred that the diatom community structure of wetlands in South Africa were dictated by the prevailing physical and chemical water quality.
4 Conclusion
The dominance of Melosira varians was indicative of organic pollution. The community structure indices however ranked the quality of the river during the study period to range between no pollution and slight/moderate pollution. The significant correlation exhibited among physical/chemical parameters, planktonic diatom abundance, species composition, distribution and community structure at different levels of significance (p<0.05 and p<0.01) indicated the strong influence the physical/chemical parameters had on diatoms. This in effect showed that planktonic-diatoms can be used as bio-indicators of water quality. More so, among the sampling sites, Station C emerged as the most impacted in terms of organic pollution.
Authors’ contributions
DBO collected/analysed the data and wrote the paper. GAM, TAM and OIT supervised the project and contributed analysis tools.
Acknowledgements
We acknowledge the Departments of Aquaculture, Fisheries Management and Environmental Management, Toxicology at the Federal University of Agriculture, Abeokuta, Nigeria for the use of research facilities. We are deeply grateful to Prof. (Mrs) M. O. Kadiri of the University of Benin, Nigeria for support with research articles. We also acknowledge the many unnamed persons that rendered support.
Adebisi A.A., 1981, The physico-chemical hydrology of tropical seasonal river-Upper Ogun River, Hydrobiology, 79: 157-165
https://link.springer.com/article/10.1007/BF00006123
Adeogun A.O., Chukwuka A.V., and Ibor O.R., 2011, Impact of abattoir wastes and saw-mill effluents on water quality of Upper Ogun River (Abeokuta), American Journal of Environmental Services, 7(6): 525-530
https://doi.org/10.3844/ajessp.2011.525.530
Adeosun F.I., Akin-Obasola B.J., Oyekanmi F.B., and Kayode J.O., 2014, Physical and chemical parameters of Lower Ogun River Akomoje, Ogun State, Nigeria, Fisheries and Aquaculture Journal, 5: 88-98
Adesalu T.A., and Nwankwo D.I., 2009, A checklist of lekki lagoon diatoms, International Journal of Botany, 5(2): 126-134
https://doi.org/10.3923/ijb.2009.126.134
Ajani G.E., 2010, The biodiversity of phytoplankton community in selected parts of the Lagos Lagoon, Nigeria, Journal of Biological Sciences and Bioconservation, 2: 1-13
Akinyemi S.A., and Sodamade A., 2015, Algae composition and physico-chemical parameters of awon reservoir, Oyo State, Nigeria, Global Journal of Science Frontier Research in Biological Science, 15(3): 27-29
https://journalofscience.org/index.php/GJSFR/article/download/1595/1456
Akinyemi S.A., Nwankwo S.A., and Fasuyi A.O., 2007, Diatoms as Indicator of Pollution in Awon Reservoir, Oyo town, Nigeria, Research Journal of Microbiology, 2(3): 228-238
https://doi.org/10.3923/jm.2007.228.238
Akoma O.C., and Opute F.I., 2011, Phytoplankton species from Imo River Estuary, Nigeria II: Centric Diatoms, Nigerian Journal of Botany, 10(4): 1-10
Awoyemi A.O., 2012, Physical and chemical parameters of Ogun river (Opeji river), Opeji village, Abeokuta, Ogun State, Nigeria., Bsc. Report, Federal University of Agriculture, Abeokuta, Ogun state, Nigeria
Ayoade A.A., Sowunmi A.A., and Nwachukwu H.I., 2004, Gill asymmetry in Labeo ogunensis from Ogun River, Southwest Nigeria, Revista de Biología Tropical, 52(1): 171-175
https://doi.org/10.15517/rbt.v52i1.14821
PMid:17357414
Bhattacharya A.K., and Bolaji G.A., 2010, Fluid flow interactions in Ogun River, Nigeria, International Journal of Research and Reviews in Applied Sciences, 2(2): 173-180
https://www.arpapress.com/Volumes/Vol2Issue2/IJRRAS_2_2_10.pdf
Bhattacharya B., 2012, The use of diatoms to infer environmental change of the lower White River, southeastern Arkansas, Thesis and Dissertations, pp.253
http://core.ac.uk/download/pdf/72841618.pdf
Biggs B.J.F., and Kilroy C., 2000, Stream periphyton monitoring manual, NIWA-New Zealand Ministry for the Environment, pp.246
https://www.niwa.co.nz/sites/default/files/import/attachments/peri_complete.pdf
Birkett K., and Gardiner S., 2014, The use of epilithic and epiphytic diatoms as indicators of organic pollution in the Cheboygan River, Cheboygan County, Michigan (Online) University of Michigan Biological Stariotl-Pellston, Michigan, USA
http://hdl.handle.net/2027.42/55043
Blanco S., Cejudo-Figueiras C., Álvarez-Blanco I., Donk E., Gross E.M., Hansson L., Irvine K., Jeppesen E., Kairesalo T., Moss B., Nõges T., and Bécares E., 2013, Epiphytic diatoms along environmental gradients in Western European Shallow Lakes, Clean-Soil, Air, Water, 41(9999): 1-7
https://doi.org/10.1002/clen.201200630
Chattová B., Fránková M., and Rozbrojová Z., 2009, Diatoms of turfy fish pond margins of the Trebon basin, Southern Bohemia, In Van dam and Cadee (eds.), Proceedings of the Joint Meeting of the Dutch-Flemish Society of Diatomists (NVKD) and 3rd Central European Diatom Meeting (CE-DiatoM) 26-29 March, Diatomededelingen, 33: 100-103
https://docs.wixstatic.com/ugd/f21ff7_97d9d833fc5e46d7bda51d3e77cc0c48.pdf
Cibic T., Blasutto O., and Falconi C., 2009, Living marine benthic diatoms as indicators of nutrient enrichment, In Van dam and Cadee (eds.), Proceedings of the Joint Meeting of the Dutch-Flemish Society of Diatomists (NVKD) and 3rd Central European Diatom Meeting (CE-DiatoM) 26-29 March, Diatomededelingen, 33: 100-103
https://docs.wixstatic.com/ugd/f21ff7_97d9d833fc5e46d7bda51d3e77cc0c48.pdf
Dash M.C., 2003, Fundamental of Ecology, 2nd Edition Tata McGrawHill publishing company limited, New Delhi
Dela-cruz J., Pritchard T., Gordon G., and Ajani P., 2006, The use of periphytic diatoms as a means of assessing impacts of point source inorganic nutrient pollution in south-eastern Australia, Freshwater Biology, 51: 951-972
https://doi.org/10.1111/j.1365-2427.2006.01537.x
Dhargalkar V.K., and Ingole B.S., 2004, Measurement of Biomass, Phytoplankton Identification Manual, pp.25-26
http://nio.org/userfiles/file/biology/Phytoplankton-manual.pdf
Dimowo B.O. 2013, Monthly spatial occurrence of phytoplankton and zooplankton in River Ogun, Abeokuta, Ogun State, Southwest Nigeria, International Journal of Fisheries and Aquaculture, 5(8): 193-203
http://www.academicjournals.org/article/article1380032785_Dimowo.pdf
Edmondson W.T., 1959, Freshwater Biology, John Wiley Sons Inc, New York, ISBN 0-471-23298-X, pp.758
Elias C.L., Feio M.J., Vieira N., and Almeida S.F.P., 2012, Can season interfere with diatom ecological quality assessment? Hydrobiologia, 695: 223-232
https://doi.org/10.1007/s10750-012-1196-8
Environmental Protection Agency (EPA), 2001, Parameters of Water Quality, Interpretation and Standards, ISBN 1-84096-015-3
http://www.epa.ie/licences/lic_eDMS/090151b280253d31.pdf
Erondu E.S., and Chindah A.C., 1991, Variations in the physico-chemical features and phytoplankton of the New Calabar River at Aluu, Rivers State, Nigeria, NIOMR Technical Paper, 75: 23
https://www.oceandocs.org/handle/1834/2441
Ferreira S.E., Almeida S.F.P., Nunes M.L., Luis A.T., Borg F., Hedlund M., De Sa C.M., Patinha C., and Teixeira P., 2009, Heavy metal pollution downstream the abandoned Coval da Mó mine (Portugal) and associated effects on epilithic diatom communities, Sci Total Environ, 407: 5620-5636
https://doi.org/10.1016/j.scitotenv.2009.06.047
PMid:19647289
Gell P.A., Sonneman J.A., Reid M.A., Illman M.A., and Sincock A.J., 1999, An illustrated key to common diatom genera from Southern Australia, Cooperative Research Centre for Freshwater Ecology, Identification Guide No.26, pp.63
Hammer P., Harper D.A.T., and Ryan P.D., 2001, PAST: Paleontological Statistics software package for education and data analysis, Palaeontologia Electronica, 4(1): 1-9
https://palaeo-electronica.org/2001_1/past/past.pdf
Harding W.R., Archibald C.G.M., and Taylor J.C., 2005, The relevance of diatoms for water quality assessment in South Africa: A position paper, Water SA 31(1): 41-46
https://doi.org/10.4314/wsa.v31i1.5119
Hosmani S.P., 2012, Fresh Diatoms as Indicators of River Water Quality, Environmental Biology, Paripex-Indian Journal of Research for All Subjects, 1(4): 36-38
IBM Corporation, 2011, IBM SPSS Statistics for Windows, Version 20.0. Armonk, NY: IBM Corp
Ikotun O.O., Olafusi O.S., Quadri H.A., and Bolarinwa O.A., 2012, Influence of human activities on the water quality of Ogun River in Nigeria, Civil and Environmental Research, 2: 36-48
https://www.iste.org/Journals/index.php/CER/article/view/3172
Janse van vuuren S., Taylor J., Van Ginkel C., and Gerber A., 2006, Easy identification of the most common freshwater algae: A guide for the identification of microscopic algae in South African freshwaters
Kadiri M.O., 2003, Diatoms from Nigeria, Algological Studies, 110: 17-26
https://doi.org/10.1127/1864-1318/2003/0110-0017
Kadiri M.O., 2007, Phytoplankton dynamics of a tropical river: A dry and rainy season comparison, Journal of Aquatic Sciences, 22: 11-26
https://www.ajol.info/index.php/jas/article/view/113284
Kadiri M.O., 2010, They bop, they sink: nature’s energy charger and aquatic environmental purifier, An Inaugural Lecture Delivered at the University of Benin
http://www.ikharoroyalfamily.com/wp-content/uploads/2015/08/Medina-Kadiri-Inaugural-Lecture.pdf
Kadiri M.O., 2011, Notes on Harmful algae from Nigerian coastal waters, Acta Botanica Hungarica, 53: 137-143
https://doi.org/10.1556/ABot.53.2011.1-2.12
Kavya S., and Savitha U., 2014, Bacillariophyceae as Ecological Indicators of Water Quality in Two Lakes of Mysore, Universal Journal of Environmental Research and Technology, 4(1): 1-11
http://www.environmentaljournal.org/4-1/ujert-4-1-1.pdf
Kelly M.G., Bennion H., Cox E.J., Goldsmith B., Jamieson J., Juggins S., Mann D.G., and Telford R.J., 2005, Common freshwater diatoms of Britain and Ireland: an interactive key (Online), Environment Agency, Bristol
http://www.isdr.org/common-freshwater-diatoms-britain-and-ireland-interactive-identification-key
Kelly M.G., Juggins S., Bennion H., Burgess A., Yallop M., Hirst H., King L., Jamieson B.J., Guthrie R., and Rippey B., 2008, Use of diatoms for evaluating ecological status in UK freshwaters, Science Report: SC030103/SR4; Environment Agency, Rio House, Waterside Drive, Aztec West, Almondsbury, Bristol, BS32 4UD
Kelly M.G., Rippey B., King L., Ní Chatháin B., Mcquillan C., and Poole M., 2006, Use of phytobenthos for evaluating ecological status in Ireland, Report to North-South Shared Aquatic Resource (NSShARe) project
https://pub.epsilon.slu.se/12244/3/kahlert_m_etal_150609.pdf
Kireta A.R., Reavie E.D., Sgro G.V., Angradi T.R., Bolgrien D.W., Hill B.H., and Jicha T.M., 2011, Planktonic and periphytic diatoms as indicators of stress on great rivers of the United States: Testing water quality and disturbance models, Ecological Indicators, 13: 222-231
https://doi.org/10.1016/j.ecolind.2011.06.006
Kivrak E., and Uygun A., 2012, The structure and diversity of the epipelic diatom community in a heavily polluted stream (the Akarçay, Turkey) and their relationship with environmental variables, Journal of Freshwater Ecology, 27(3): 443-457
https://doi.org/10.1080/02705060.2012.671147
Lemke P., and Zgrundo A., 2009, Studies on planktonic diatoms-methodological aspects (case study from the Vistula River mouth), In Van dam and Cadee (eds.), Proceedings of the joint Meeting of the Dutch-Flemish Society of Diatomists (NVKD) and 3rd Central European Diatom Meeting (CE-DiatoM) 26-29 March, Diatomededelingen, 33: 100-103
https://docs.wixstatic.com/ugd/f21ff7_97d9d833fc5e46d7bda51d3e77cc0c48.pdf
Lobo E.A., Callegaro V.L.M., Hermany G., Bes D., Wetzel C.A., and Olivera M.A., 2004, Use of epilithic diatoms as bioindicators from lotic systems in southern Brazil, with special emphasis on eutrophication, Acta Limnologica Brasieliensis, 16(1): 25-40
http://www.ablimno.org.br/acta/pdf/acta_limnologica_contents1601E_-files/art3_16(1).pdf
Mackay A.W., Davidson T., Wolski P., Woodward S., Mazebedi R., Masamba W.R.L., and Todd M., 2011, Diatom sensitivity to hydrological and nutrient variability in a subtropical, flood-pulse wetland Ecohydrology, 5: 491-502
https://doi.org/10.1002/eco.242
Mann D.G., 2010, Diatoms, Version 07 February 2010 (Online), in The Tree of Life Web Project
http://tolweb.org/Diatoms/21810/2010.02.07
Martin G., and Fernandez M., 2012, Diatoms as Indicators of Water Quality and Ecological Status: Sampling, Analysis and Some Ecological Remarks, In: Dr. Voudouris (Ed.) Ecological Water Quality-Water Treatment and Reuse, InTech, pp.183-204
https://pdfs.semanticscholar.org/8565/a35f5cec58b19892dc339835bd740207e7a8.pdf
Martins O., 1987, The Ogun River: geochemical characteristics of a small drainage basin, Mittl. Geol. Palaonst. Inst. Univ. Hamb, 64: 475-482
Matlala M., Taylor J.C., and Rensburg L., 2008, The use of diatoms to indicate the quality of water in wetlands, a south African perspective, Water SA, 145: 10-25
https://dspace.nwu.ac.za/bitstream/handle/10394/4410/Matlala_MD.pdf
Merck, 2014, Spectroquant Nova 60 Operating manual, Merck KGaA, 64271 Darmstadt, Germany, pp.297
Microsoft Corporation, 2006, Microsoft Excel, Version 2007, Microsoft Office Suite, DVD
National Bureau of Statistics (NBS), 2012, State Information (Online), (25 Jan. 2015)
https://www.nigerianstat.gov.ng/information/details/Ogun
Nelson D.M., Tréguer P., Brzezinski M.A., Leynaert A., and Quéguiner B., 1995, Production and dissolution of biogenic silica in the ocean: revised global estimates, comparison with regional data and relationship to biogenic sedimentation, Global Biochemical Cycles, 9: 359-372
https://agupubs.onlinelibrary.wiley.com/doi/pdf/10.1029/95GB01070
Ogbeibu A.E., 2005, Biostatistics: a practical approach to research and data handling, Mindex Publishing Company limited, Benin City, Nigeria
Ojekunle Z.O., Ufoegbune G.C., Oyebamiji F.F., Sangowusi R.O., Taiwo A.M., and Ojekunle V.O., 2014, Assessment of the effect of commercial activities on the surface water quality of Ogun River, Nigeria, Merit Research Journal of Environmental Science and Toxicology, 2: 196-204
https://www.meritresearchjournals.org/est/content/2014/December/Ojekunle%20et%20al.pdf
Ojelade O.C., Abdul W.O., Abdulraheem I., Ikenweiwe N.B., Salaudeen A.A., and Akaeze M.I., 2016, Response of plankton assemblage to nutrient and environmental parameters in a tropical coastal water, Ife Journal of Science, 18(3): 801-811
https://www.ajol.info/index.php/ijs/article/view/156033/145660.
Ojo O.O., 2011, Plankton estimation and diversity of lower basin of Ogun river at Isheri-olofin area, Ogun state, South western, Nigeria. Bsc. Dissertation, Federal University of Agriculture, Abeokuta, Ogun state, Nigeria, pp.32
http://journal.unaab.edu.ng/ugprojects/2011baquacojooo.pdf
Oketola A.A., Osibanjo O., Ejelonu B.C., Oladimeji Y.B., and Damazio O.A., 2006, Water quality assessment of River Ogun around the cattle market of Isheri, Nigerian Journal of Applied Science, 6: 511-517
https://doi.org/10.3923/jas.2006.511.517
Olayinka O.O., Adedeji O.H., and Oladeru I.B., 2013, Water quality and bacteriological assessment of slaughterhouse effluent on urban river in Nigeria, Journal of Applied Sciences in Environmental Sanitation, 8(4): 277-286
Olele N.F., and Ekelemu J.K., 2008, Physico-chemical and periphyton/phytoplankton study of Onah Lake, Asaba, Nigeria, African Journal of General Agriculture, 4(3): 183-193
https://www.ajol.info/index.php/dai/article/view/48181
Online Nigeria, 2016, Physical setting of Ogun State (Online)
https://www.onlinenigeria.com/ogun-state/?blurb=337
Onuoha P.C., Nwankwo D.I., and Vywerman W., 2010, Diatoms of tropical eutrophic Lagoon, Journal of American Science, 6(11): 452-456
https://docplayer.net/94654987-Diatoms-of-tropical-eutrophic-lagoon.html
Onyema I.C., 2013, Phytoplankton bio-indicators of water quality situations in the Iyagbe Lagoon, South-Western Nigeria, Journal of the Life and Physical Sciences, 4(2): 93-107
https://www.actasatech.com/download.php?file=Journal-141.pdf
Onyema I.C., Nwabuzor E.J., and Igwe C.O., 2014, The water quality phytoplankton and zooplankton of the Lower Ogun River Lagos, International Journal of Life Sciences, 3(2): 16-25
http://www.crdeepjournal.org/wp-content/uploads/2014/04/Vol-3-2-2-IJLS.pdf
Onyema I.C., Nwankwo D.I., and Oduleye T., 2006, Diatoms and dinoflagellates of an Estuarine Creek in Lagos, Journal of Scientific Research and Development, 10: 73-82
http://www.savannahstate.edu/cost/nat-science/docs/documents/diatomdinosofestcreekLagos.pdf
Osunkiyesi A.A., 2012, Physico-chemical analysis of Ogun River (water samples) within two locations (Akin Olugbade and Lafenwa) in Abeokuta, Ogun State, Nigeria, IOSR Journal of Applied Chemistry, 1(4): 24-27
http://www.iosrjournals.org/iosr-jac/papers/vol1-issue4/E0142427.pdf
Picinska-Faltynowicz J., and Blachuta J., 2009, Assessment of ecological status of Polish running waters by diatom phytobenthos-the present approach, In Van dam and Cadee (eds.), Proceedings of the joint Meeting of the Dutch-Flemish Society of Diatomists (NVKD) and 3rd Central European Diatom Meeting (CE-DiatoM) 26-29 March, Diatomededelingen, 33: 85-87
https://docs.wixstatic.com/ugd/f21ff7_97d9d833fc5e46d7bda51d3e77cc0c48.pdf
Pielou E.C., 1966, The measurement of diversity in different types of biological collections, Journal of Theoretical Biology, 13: 131-144
https://doi.org/10.1016/0022-5193(66)90013-0
Reid M.A., Tibby J.C., Penny D., and Gell P.A., 1995, The use of diatoms to assess past and present water quality, Australian Journal of Ecology, 20: 57-64
http://doi.org/10.1111/j.1442-9993.1995.tb00522.x
Rejeki S., Suryanto A., Hutabarat J., Anggoro S., and Ruswahyuni, 2012, Evaluation of idle eroded coastal water for mariculture based on thropic saprobic index analysis (case study: Coast of Sayung Distric Demak, Central Java Indonesia), Journal of Coastal Development, 15(3): 324-333
http://www.ejournal.undip.ac.id/index.php/coastdev/article/download/4022/3697
Sabanci F.C., 2011, Relationship of epilithic diatom communities to environmental variables in Homa lagoon (Izmir, Turkey), Aquatic Biology, 13: 233-241
https://doi.org/10.3354/ab00367
Salusso M.M., and Morrana L.B., 2002, Comparison of biotic index used in monitoring of 2 lotic systems in North-Western Argentina, J. Biol Trop. Mar, 50(1): 327-336
http://www.ncbi.nlm.nih.gov/pubmed/12298261
Shah J.A., and Pandit A.K., 2013, Application of diversity indices to crustacean community of Wular Lake, Kashmir Himalaya, International Journal of Biodiversity and Conservation, 5(6): 311-316
https://academicjournals.org/journal/IJBC/article-full-text-pdf/CB1FD8310735
Shannon C.E., and Weaver W., 1949, The mathematical theory of communication, Urban University, Illinois Press, Illinois, pp.125
http://www.magmamater.cl/MatheComm.pdf
Simpson E.H., 1949, Measurement of diversity, Nature, 163: 688-688
https://doi.org/10.1038/163688a0
Taiwo A.G., Adewunmi A.R., Oseni O.A., Ajayi J.O., and Lanre-Iyanda Y.A., 2014, Physico-chemical and microbial analysis of the impact of abattoir effluents on Ogun River Course, International Journal of ChemTech Research, 6(5): 3083-3090
http://sphinxsai.com/2014/vol6pt5/7/(3083-3090)S-2014.pdf
Tan X., Sheldon F., Bunn S.E., and Zhang Q., 2013, Using diatom indices for water quality assessment in a subtropical river, China, Environmental Science and Pollution Research, 20(6): 4164-4175
https://doi.org/10.1007/s11356-012-1343-9
Tanimu Y., Bako S.P., Adakole J.A., and Tanimu J., 2011, Phytoplankton as bioindicators of water quality in saminaka reservoir, Northern-Nigeria, In: Proceedings of the 2011 International Symposium on Environmental Science and Technology, Dongguan, Guangdong Province, China, Science Press, USA, pp.318-322
Taylor J.C., 2004, The application of diatom-based pollution indices in the vaal catchment, Msc. Dissertation, North-West University
http://hdl.handle.net/20.500.11892/14070
Taylor J.C., Harding W.R., Archibald C.G.M., and Rensburg L., 2005, Diatoms as indicators of water quality in the Jukskei-Crocodile river system in 1956 and 1957, a re-analysis of diatom count data generated by BJ Cholnoky, Water SA, 31(2): 237-246
https://doi.org/10.4314/wsa.v31i2.5176
Theriot E.C., 2012, Diatoms, citable reviews in the life sciences (Online), (31 Jan. 2015)
https://doi.org/10.1002/9780470015902.a0000330.pub2
UCMP, 2015, Diatoms: life history and ecology, (31 Jan. 2015)
http://www.ucmp.berkeley.edu/chromista/bacillariophyta.html
Van Dolah F.M., 2000, Marine algal toxins: origins, health effects, and their increased occurrence, Environmental Health Perspectives Supplements, 108(1): 133-141
http://core.ac.uk/download/pdf/4110172.pdf
Wang X., Zheng B., Liu L., and Li L., 2014, Use of diatoms in river health assessment, Annual Research and Review in Biology, 4(24): 4054-4074
https://doi.org/10.9734/ARRB/2014/11963
Weng T.K., and Beh W.C., 2015, Water quality monitoring using biological indicators in cameron highlands Malaysia, Journal of Sustainable Development, 8(3): 28-42
http://www.ccsenet.org/journal/index.php/jsd/article/download/44527/26147
Whittaker R.H., 1965, Dominance and diversity in land plant communities, Science (Washington, D.C.), 147: 250-260
https://doi.org/10.1126/science.147.3655.250
PMid:17788203
Wilhm J.L., and Dorris T.C., 1968, Biological parameters of water quality criteria, Bioscience, 18: 477-481
https://doi.org/10.2307/1294272
Wokoma O.A.F., Nwaogu V.O., Chima G.N., and Gbosidom V.I., 2016, Phytoplankton species composition and abundance in Lower Sombreiro River, Niger Delta, Nigeria, Journal of Environmental Science, Computer Science and Engineering and Technology, 5(2): 223-229
Zgrundo A., Lemke P., and Majewska R., Diatoms of the Vistula River mouth-taxonomy and ecological interpretation, In Van dam and Cadee (eds.), Proceedings of the joint Meeting of the Dutch-Flemish Society of Diatomists (NVKD) and 3rd Central European Diatom Meeting (CE-DiatoM) 26-29 March, Diatomededelingen, 33: 132-134
https://docs.wixstatic.com/ugd/f21ff7_97d9d833fc5e46d7bda51d3e77cc0c48.pdf
Zimmerman M.C., 1993, The use of the biotic index as an indication of water quality, pp.85-98, in Tested studies for laboratory teaching, Volume 5 (C.A. Goldman, P.L.Hauta, M.A. O’Donnell, S.E. Andrews, and R. van der Heiden, Editors), Proceedings of the 5th Workshop/Conference of the Association for Biology Laboratory Education (ABLE), pp.115
Zolan C.J., 1981, Diatom assemblages as indicators of water quality in freshwater habitats of Guam, Water and Energy Research Institute of the Western Pacific, Technical Report No. 29, OWRT Project No. A-012-Guam, Grant Agreement No. 14-34-0001-9012


Associated material
. Readers' comments
Other articles by authors
. Benjamin Dimowo
. Adewole Gbadebo
. Adewale Taiwo
. Isaac Omoniyi
Related articles
. Applied ecology
. Bioassessment
. Ecosystem health
. Environmental management
. Surface water bio-indicators
Tools
. Post a comment