Mangrove correlation; Aquaculture primary production; Aquaculture secondary production; Benefit value; Fisheries production
If managed optimally and sustainably, a mangrove ecosystem is one of the coastal ecosystems that has avariety of benefits that can augment its surrounding community’s welfare. Mangrove ecosystems are veryrich innutrients; therefore, they have the potential to increase the production of aquaculture and capture fisheries (Dahuri et al., 1996).
Mangrove ecosystems have potentialtobe developed to increase aquaculture production and coastal fisheries catches. Aquaculture production positively correlates with the presence of mangrove ecosystems adjacent to the aquaculture area (Meilani, 1996). Consistent with this statement, Denila (1987) revealed that abundance of shrimp and fish fry along the coast of Sinjai District increases parallel with the increased size of mangrove ecosystem. This statement confirmed by Ronback (1999) who argued that increased economic value of ponds correlates with the presence of mangrove ecosystems neighboring the ​​aquaculture ponds.
The existence of mangrove ecosystems in coastal areas attractsa variety of organisms for both permanent and temporary habitat purpose. A wide assortment of organisms come to mangrove ecosystems for different reasons, i.e. eating and spawning as well as refuge from natural threats such as current and waves and from other threats such as predation of larger organisms. Other organisms visit this ecosystem merely to fulfill their lifecycle.
The presence of mangrove ecosystems in a particular aquaculture area can increase not only the produce of coastal fisheries and fisheries catch, but it can also increase biodiversity (Suprihartono, 2005). For the purpose of sustainable produce of aquaculture and biodiversity, the existence of mangrove ecosystem in the vicinity of coastal aquaculture areas must be preserved by the adoption of Silvofishery management. This type of management is an approach that merges conservation efforts into resource utilization efforts.
This study aims to analyze the correlation between (1) mangrove ratio percent age and increased primary aquaculture produce, (2) mangrove ratio percent age and increased secondary aquaculture produce, (3) mangrove ecosystem direct benefit value and increased coastal catch produce per Silvofishery ratio.
1 Result and Discussion
1.1 Overview
Sinjaiis one of the coastal districts in South Sulawesi province, situated in the eastern part of South Sulawesi and borders Bone to the north, BoneBay waters to the east, South Bulukumba district to the south, and Gowadistrict to the west. Sinjai district has nine small islands called Nine Islands, and has a coastline spanning 31 km, 17 km of which lies along secondary the the main land and another 14 km surrounds the islands (Biro Pusat Statistik, 2010). Along the coastline there is a potential of​​ mangrove ecosystems with total area of 1 351.50 ha. spreads across three coastal sub-districts with sizes as follows: (1) NorthSinjai sub-district covering 254.10 ha or 18.84%, (2) EastSinjai sub-district covering 947.50 or 70.02%, and (3) Tellulimpoe sub-district covering an area of​​ 150.50 ha or 21.14% (Dinas Kelautan dan Perikanan Kabupaten Sinjai, 2010).
In addition to mang roveeco systems, along the coast of Sinjai district there is a potential of aquaculture area of​​ 1 033 ha, yet until 2011 only 716.50 ha of this area had been optimally utilized. This pond area is managed by different levels of technology packagesas follows: traditional plus 90%, 7.5% semi-intensive and intensive 2.5% respectively. The average of pond produce for shrimp is 241 kg·ha-1·yr-1 and for milk fish 670 kg·ha-1·yr-1 (Dinas Perkeunan dan Kehutanan Kabupaten Sinjai, 2011). The comparison between the size of mangroves and pond sin Sinjai district is 65.35% and 34.65%.
The results of several previous studies e.g. (Kathiresan and Bingham, 2001) reveal that the conversion of mangrove ecosystem into ponds should not exceed 70% because failing to do so would disrupt the ecological functions of mangrove ecosystems as nutrient providers.
1.2 Aquaculture Produce and Benefit Value
Aquaculture system applied to the Silvofishery pond is poly culture of shrimp, with milkfish as the primary produce. Seaweed is not cultivated by reason of limited sunlight. The surrounding ponds, however, cultivate shrimp, milkfish and seaweedas their primary cultivation. This poly culture approach is consecondary red to have ecological, economic, and social benefits.
Poly culture system or diversified cultivation in Silvofishery ponds ecologically aims to increase nitrogen, phosphorus, and calcium through decomposition processes. All nutrients can be utilized by various cultured biota, so the potential for deteriorating soil and water quality can be minimized. Poly culture of shrimp, milkfish and seaweed formsa mutually beneficial symbiosis.
The poly culture of shrimp, milk fishand seaweed in ponds economically aims to make efficiency in all utilization of land resources use, operating costs, labor and so on. Poly culture system is said to be able to maintain the efficiency of land because it can preserve some types of organisms on the soil at the same time, minimizing costinputs such as fertilizer, drugs and laborissues.
In addition, the adoption of poly culture systemin Silvofishery pond is aimed at maintaining biodiversity; the higher the biodiversity of an ecosystem, the higher the ecological, economic and social functions. Further, poly culture systems may involve some seasonal workers at harvest time, as energy harvesters, transporters, andsellers. That means the more various commodity types in a particular pond, the more labors are needed to deliver them to end customers.
Be secondary sprimary cultivated organisms such as shrimp, milkfish, and seaweed, there are other secondary organisms of various types of wild fish, wild shrimp, and so forth which are also of high economic value. The analysis results of Silvofishery pond total produce maintenance cycle-1 reveals that secondary aquaculture produce helps primary aquaculture produce, in addition to direct benefit of mangrove ecosystem (Asbar, 2007).
1.2.1 Primary Aquaculture
The analysis of primary aquaculture produce results in the following average scores: (1) shrimp by 241 kg·ha-1·yr-1, and (2) milkfish by 670 kg·ha-1·yr-1. Silvofishery pond produce in Sinjai, when compared to Silvofishery pond producein Tangerang, is relatively similar with shrimp weighted to 200 kg·ha-1·yr-1 and milkfish of 700 kg·ha-1·yr-1 (Soewardi, 2011). The primary aquaculture produce perpond ratio is presented in Table 1.
 Table1 Average of primary aquaculture produceper Silvofishery pond ratio (Rp/th)
 |
This analysis results show that primary aquaculture produce on the Silvofishery management negatively correlates with mangrove ratio percentage, the greater mangrove ratio than pond ratio on Silvofishery pond management, the lesser primary aquaculture produce; in contrast, coastal fisheries produce of wild shrimp and wild fish as well as direct benefit from mangrove ecosystem increases. There is a negative correlation between the mangrove ratio and primary aquaculture produce both directly and indirectly. (1) directly, the greater mangrove ratio than ponds in Silvofishery management, the narrower the area allotment for the primary cultivation, and (2) indirectly, the greater the mangrove ratio than ponds, mangrove litter produce is higher and potentially affects the quality of soil and water and prevents the primary aquaculture organism from being able to optimally adapt to the environment to minimize mortality and maximize growth rate (Beukeboom, 2012). The correlation between mangrove ratio percent age and primary aquaculture produce in Silvofishery management is presented in Figure 1.
.png) Figure 1 Correlation between primary aquaculture produce per Silvofishery pond ratio
Figure 1 Correlation between primary aquaculture produce per Silvofishery pond ratio |
Results of correlation and regression analysis between the percent age of mangrove ratio and pond ratio and primary aquaculture produce generate the following equation y=-0.091x+8.800 which is interpreted that each 1% decrease in mangrove area will increase the of primary aquaculture produce in Silvofishery ponds by Rp 91.000 th-1 with value of R2=0.99. This means that 99% increase inprimary produce may explainits association with the mangrove and ponds ratio percentage on Silvofishery management, while the remaining 1% of aquaculture produce can be explained by other factors. This study results confirm a research conducted by (Naamin, 1990) who argued that the presence of mangroves in the area surrounding ponds increases ponds produce.
1.2.2 Secondary Aquaculture
The study analyzes the secondary aquaculture produce in Silvofishery ponds consisting of various types of wild shrimp and wildfish. Both commodity types are considered as secondary because they are regarded as produce, even if stocking of both types of organisms is not carried out. The secondary aquaculture produce analysis results reveal average scoresas follows: (1) wild shrimp of 59.40 kg·ha-1·yr-1, and (2) wild fish of 69.30 kg·ha-1·yr-1. The main aquaculture produce per Silvofishery pond ratiois presented in Table 2.
 Table 2 The average of secondary aquaculture produce per Silvofishery ratio (Rp/th)
 |
The analysis results suggest that the secondary aquaculture produce has a positive correlation between mangrove ratio percent age and ponds with secondary aquaculture produce in Silvofishery management. Unlike primary aquaculture produce, The greater the mangrove ratio percentage than pond ratio in Silvofishery management, the higher secondary aquaculture produce. One of the probable causesis because secondary aquaculture organisms are more adaptable to the environment influenced by mangrove. In addition, secondary aquaculture maintenance time is relatively shorter, allowing several harvests in one cycle. The correlation between mangrove ratio percentage and secondary aquaculture produce in Silvofishery pond management is presented in Figure 2.
.png) Figure 2 Correlation of secondary aquaculture produce Silvofishery pond ratio
Figure 2 Correlation of secondary aquaculture produce Silvofishery pond ratio |
Results of regression analysis between secondary aquaculture produce with mangrove ratio percentage and ponds with secondary aquaculture produce in Silvofishery pond management generates an equation of y=0.016x+0239, which is interpreted that every 1% increase in mangrove ecosystem area will increase the value of secondary aquaculture produce in Silvofishery management as much as Rp.16 000 th-1with R2 value of 0.99. This meansa 99% increase in secondary aquaculture producein Silvofishery ponds. The results of this study confirm a previous research by (Niartiningsih, 1996) who argued that the presence of mangrove ecosystems in coastal areas may increase the catch of shrimp and fish fries.
1.2.3 Direct Benefit Value
Mangrove ecosystem has ecological, economic, and social functions from which mangrove ecosystem benefits in the forms of, (1) direct benefit value, (2) indirect benefit value, (3) choice benefit, and (4) existence benefit. Mangrove ecosystem direct benefit value is associated with coastal waters fishery produce results, be that aquaculture fisheries or catch fisheries. The direct benefit of mangrove ecosystem is in the form of coastal waters fishery produce based on the area of mangrove ecosystem in Silvofisherypond management as presented in Table 3.
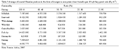 Table 3 Average of coastal fihseries produce in the form of mangrove ecosystem direct benefits per Silvofishery pond ratio (Rp th-1)
 |
Analysis results of direct benefit value of mangrove ecosystems in the form of coastal waters fishery produce reveal apositive correlation with mangrove ratio percentage and ponds in Silvofishery management; the greater the mangrove ratio, the more coastal water fisheries results. Figure 3 below describes the correlation between mangrove ratio percent age and direct benefits of mangrove ecosystem in the form of increased coastal fisheries produce.
.png) Figure 3 Correlation of mangrove ecosystem direct benefit value in the form of coastal waters catch results
Figure 3 Correlation of mangrove ecosystem direct benefit value in the form of coastal waters catch results |
Results of regression analysis suggest that direct benefit value from mangrove ecosystems positively correlates with mangrove ratio percentage and pondson Silvofishery management, resulting an equation of y = 0.485x-0.347 which is interpreted that every 1% increase in the size of mangrove ecosystem will increase direct benefit value as much as Rp. 485.000 th-1 with R2 0.99. This means that 99.9% of increased aquaculture produce in Silvofishery pond correlates with mangrove ratio percentage in Silvofishery pond. This confirms by Alam (1997) on converting ecosystem into pond with average produce of Rp.6467.799 ha-1 th-1 yet causes ecological loss as much as Rp.33122.013 ha-1 th-1.
According (Zuna, 1998), increased mangrove area not only increases the direct benefit of the mangrove ecosystem, but it also increases the biodiversity of flora and fauna therein. One of the objectives of the Silvofishery management isto realize a balanced ecosystem, so in terms of ecology and economy, mangrove ecosystem can function optimally and sustainably (Beukeboom et al., 1992).2 Conclusion
Based on the analysis results of correlation and regression equation, it can be concluded that: (1) the primary aquaculture produce negatively correlates and generates an equation of y=-0.091x+8.800 with R2=0.99, (2) secondary aquaculture produce positively correlates and generates an equation of y=0.016x+ 0.239 with R2=0.99, and (3) the direct benefit of mangrove ecosystem positively correlates and generates an equation of y=0.485x-0347 with R2=0.99.
3 Research Method
3.1 Location and Time
The research was conductedin Samataring village and TongkeTongke village, East Sinjai Sub-district, Sinjai District, over six months from July to December 2011.
3.2 Fisheries Production
Toanalyze the primary and secondary aquaculture produce per Silvofishery ratio, interviews with Silvofishery pond managers were conducted. The primary and secondary aquaculture produce include; shrimp, milk fish, wilds hrimp, and wildfish. At the same time, to see the direct benefit value of mangrove ecosystems a literature study was undertaken. The latter covers reviews of different produces, for instance, shrimp, milk fish, seaweed, wild shrimp, wildfish, crabs, shellfish, shrimp and fish fry.
Prior to the analysis of primary aquaculture produce, secondary aquaculture produce, and the direct benefit value of mangrove ecosystems per Silvofishery ratio, a conversion from kilograms or units into rupiahs was conducted to facilitate the analysis of benefit cost ratio. The results of benefit cost ratio are broken down into two, namely specific analysison primary aquaculture and secondary aquaculture, and gener alanalysis on primary aquaculture, secondary aquaculture and direct benefit value of mangrove ecosystem.
3.3 Correlation Analysis and Regression Equation
To analyze the correlation and regression equations of primary aquaculture produce and secondary aquaculture produce, and the direct benefit value of mangrove ecosystem in Silvofishery pond management, the following equations are used:
3.3.1 Correlation Analysis
To examine the correlation coefficient between increased mangrove ecosystem area and increased primary aquaculture produce, secondary aquaculture produce, and catch fisheries produce in the form of direct benefit value per Silvofishery pond ratio, the equation below is used (Kuswadi, 2004):
3.3.2 Regression Equation
To assess the value of regression equation between increased mangrove ecosystem area and increased fisheries produce, fisheries and shrimp and fish fry catch, the equation (Kuswadi, 2004) below is used:
Y=a+bX
where:
Y= Fisheries produce;
X= Mangrove ecosystem area.
Alam S., 1997, Kajian Ekonomi-Ekologi Pertmbakan pada Ekosistem Mangrove Mengantipasi dampak Pembangunan terhadap Lingkungan Kawasan Pantai, Jurnal Penelitian Pusat studi Lingkungan Universitas Hasanuddin, Makassar, 2: 12-21
Asbar, 2007, Optimalisasi Pemanfaatan Kawasan Pesisir untuk Pengembangan Budidaya Tambak di Kabupaten Sinjai, Sulawesi Selatan, Disertasi Sekolah Pascasarjana Institut Pertanian Bogor,
http://iirc.ipb.ac.id/handle/123456789/40567
Beukeboom H., Lai C.K., and Otsuka M., 1992, Report of the regional expert consultation on partcipatory agroforestry and silvofisherry system in southeast asia-pasifik agroforestry network, 45-64
Biro Pusat Statistik, 2010, Sinjai Dalam Angka 2009, Biro Pusat Statistik, Sulawesi Selatan
Dahuri R., Rais J., Ginting S. P., dan M. J., Sitepu M. J., 1996, Pengelolaan sumberdaya pesisir dan lautan secara terpadu, PT Pradnya Pramita Jakarta
Denila L., 1987, Layout desain construction and levelling of fishpond, Readings on aquaculture practices, SEAFDEC, Aquaculture Departement, Iloilo, Philippines, 24-45
Dinas Kelautan dan Perikanan Kabupaten Sinjai, 2010, Potensi Pertambakan. Laporan Tahunan Dinas Kelautan dan perikanan Kabupaten Sinjai
Dinas Perkeunan dan Kehutanan Kabupaten Sinjai, 2011, Perkembangan luas hutan mangrove di Kabupaten Sinjai berdasarkan desa dan kelurahan dari tahun (1991-2010)
Kathiresan K, and B. L Bingham, 2001, Biology of mangroves and mangrove ekosistem,Avances in marine Biology,40:81-251
Kuswadi dan E, Mutiara 2004, Statistik berbasis komputer untuk orang-orang nonstatistik (stanon),Cara mudah dan cepat memahami statistik berbasis komputer dan aplikasinya. penerbit pt elex media komputindo kelompok gramedia jakarta
Meilani M M., 1996, Studi Pemanfaatan Hutan Mangrove Untuk Usaha Perikanan Studi Kasus di Desa Mayangan, Pamanukan, Kabupaten Subang, Jawa Barat. Skripsi Sekolah Program Studi Sosial Ekonomi Perikanan, Fakultas Perikanan – IPB Bogor
Naamin N., 1990, Penggunaan hutan mangrove untuk budidaya tambak, Keuntungan dan kerugiannya, Dalam Prosiding Seminar lV Ekosistem hutan mangrove, MAB Indonesia- LIPI Bandarlampung
Niartiningsih A., 1996, Studi tentang komunitas pada musim hujan dan kemarau di hutan bakau rakyat sinjai timur, kecamatan sinjai timur, kabupaten sinjai, Tesis Program Pascasarjana Universitas Hasanuddin, Makassar
Ronback P., 1999, Analisis the ecological basis for economic value of seafood produce supported by mangrove ekosistem, Ecological economis, 29: 235-252
Soewardi K, 2011, Bahan kuliah mahasiswa pascasarjana program studi pengelolaan sumberdaya pesisir dan lautan institut pertanian bogor
Suprihartono, 2005, Konservasi Sumberdaya Hayati di Wilayah Pesisir dan Laut Tropis, Pustaka Pelajar, Yogyakarta
Zuna M. Y., 1998, Analisis Ekologi- Ekonomi system tambak tumpangsari di RPH, Proponcol desa mayangsari kabupaten subang, tesis magister program pascasarjana institut pertanian bogor

 Author
  Correspondence author
.png)
.png)
.png)
.png)


