1. Fisheries Research Centre 5th Ave and 246 Barlovento, Sta. Fe, Playa, Ciudad Habana, Cuba
2. Pernambuco Federal University, Technology and Geoscience’s Centre, Oceanography Department, Recife, Brazil

Author

Correspondence author
International Journal of Marine Science, 2014, Vol. 4, No. 20 doi: 10.5376/ijms.2014.04.0020
Received: 23 Nov., 2013 Accepted: 20 Dec., 2013 Published: 11 Mar., 2014
Pink Shrimp; Spatial and temporal variability; Fishing resource; Guacanayabo´s Gulf; Cuba
Guacanayabo´s Gulf is located in southeast platform in Cuba and it’s an aquatic system in contact with the CaribbeanSea waters. On its middle there is The Gran Banco de Buena Esperanza (The Big Shoalof Good Hope), a relative largeregion that subdivides it in two inner basins (Figure 1). This Gulf covers an area of 9 398 km² and has an average depth of 12 m, where the outer boundary is defined by the insular slope steep decline. The underwater terrain is uneven, with gentle slopes from the coast to the Gran Banco de Buena Esperanza, has maximum depths between 20-25 m. The background is gray sand, with seashells on the periphery of the coral formations; coral sandy to the south of the Gran Banco de Buena Esperanza and in the coastal area is occupied by see grass extensions.
.png)
Figure 1 Geographical localization of Guacanayabo´s Gulf and sampling sites
|
In Guacanayabo’s Gulf, predominant winds came from the first (N-E) and second (E-S) grids, during summer with mean velocities of 7-11 km per hour and from fourth (W-N) and first grids in winter, with velocities between 5-7 km per hour. Waters movement in the system are determined by reverse tide currents (intense and moderate intensity) and NW derivative with tide influence.
The general direction of the current is to the west, which coincides with winds direction. However this current pattern has local variations in dependence of zone topography, coast configuration, tide action according to coast approach and winds when they blow with remarkable persistence and velocity. In the external part of the gulf, the tide is regular, of little amplitude and semidiurnal; while in the internal part is of highest amplitude and irregular semidiurnal. The highest amplitude in this internal part is (0.5 – 0.8 m) (Emilsson and Tápanes, 1971).
Cuba’s clime is classified as tropical wet. It is remarkable the raining period from May to October and another less raining period from November to April. Mean temperature is about 24.8?, while mean annual precipitations are about 1 278.9 mm (www.met.inf.cu).
Guacanayabo´s Gulf is a very important place from the social and economic point of view, mainly due to the different kind of fisheries that take account there. That is why is has been studied and characterized by different sea and/or oceanographic institutions. Many articles exist that describe oceanographic and biological characteristics as well as interrelations between hydro meteorological variables and marine species (EmilssonandTápanes, 1971; Lluis-Riera, 1977; Pérez et al., 2003; Sosa, 2003; Fernández-Vila, 2006; Garcés and Betanzos, 2010; Giménez et al., 2012).
Pink shrimp as fisheries resource, takes the second place in Cuban fisheries industry exportations and Guacanayabo gulf it was used to obtain about the 35% of total catches (Sosa, 2003). Those capture volumes has been decreased to the 5% at nowadays capture (600 tons). Plausible causes of the decline are related to the increased capacity of water reservoirs in the tributaries that flow into the Gulf, giving as consequence a decrease in nutrients and mud (Garcés and Betanzos, 2010), change in habitat, food potential reduction as well as over fisheries and recruitment failure (Font, 2000; Sosa, 2000 y 2003).
For those reasons, hydrological samples were taken in Guacanayabo´s Gulf in different seasons in 2008 and 2009, to get actualization of seasonal and spatial variability of aquatic media, because those factors (water temperature, salinity, dissolved oxygen, and chemical oxygen demand (COD)) could influence the abundance levels of the species. Taking into a consideration that local hydrological and hydro- meteorological characteristics impact or determine the behaviour and distribution of aquatic organisms, in this work a seasonal and spatial variation analysis is presented to Guacanayabo’s Gulf in the 2008-2009 period and its possible relation with the decrease of commercial captures of Farfantepenaeus notialis.
1 Results
1.1 Variations of hydrometeorological parameters and pink shrimp catches
1.1.1 Monthly performance of climatic variables
The raining period (May-October) is very well observed in relation with measured meteorological variables, with positive anomalies (Figure 2). For the historical mean, two main peaks of raining are very well defined, From May to June and from August to September according to registered data. For each year the monthly variations of climatic parameters showed different tendencies. The maxima of positive precipitation anomalies in 2008 were manifested in spring, with highest value in March and a second peak in the transition month, August, from summer to autumn.On the other hand, in 2009 the highest levels of precipitation were observed at the end of the spring (May) and in autumn (October). The maxima of positive anomalies of evaporation for the studied months were shown in months in which raining are decreased (Figure 2). Annual pluvial cumulate in 2008, 1181.8 mm was higher to this one of 2009 (1094.7 mm) and than general mean (1138 mm). At the same time, the monthly mean of 2008 evaporation (64.22 mm), was lesser than in 2009 (84.92 mm; Figure 2).
.png)
Figure 2 Monthly variation of precipitation and evaporation in Manzanillo MeteorologicalStationfor 2008 (a) and 2009 (b). General average 1974 – 2007 means for rainfall
|
1.1.2 Hydrological parameters
Vertical distribution of analyzed markers did not exhibit significant differences between surface and bottom, meaning that there is a homogeneous variation in water column. Standard deviations on sampling network sites indicate little variation among them (data not shown). On the other hand, lineal regression between pairs of each marker indicates a high dependence of bottom values in relation to the surface ones (Table 1).
.png)
Table 1 Average values ??of physic and chemical water’s markers in Guacanayabo’s Gulf for 2008 and 2009 years |
Mean water temperature in Guacanayabo´s gulf was 29.5? and the monthly variation was in accordance with each season period. Extreme values moved between maximum of 32.8? (August 2008) and minimum of 24.8? (November 2008).The seasonal cycle of the monthly means decreased to the minimum in autumn and increased to the maximum in summer (Table 2). On the other hand, salinity had similar averages for all seasons of the year (Figure 3), as well as their maximum values (Table 2).The extremes had varia-tions among 30 psu and 36 psu registered in autumn (September 2008), with general mean of 34.8 ± 0.96 psu.
.png)
Table 2 Variation of physical parameters for different climatic seasonsin Guacanayabo´s Gulf for 2008-2009 period
|
.png)
Figure 3 Seasonal distribution of hydrological parameters in Guacanayabo´s Gulf. Sampled values were in relation with seasonality of precipitations and the evaporation rate
|
The average dissolved oxygen concentration (DO) was 5.10 ± 0.82 mg/L, with extreme values of 2.9 mg/L (August 2008) and 6.7 mg/L (May).
Extreme values of COD were among 0.01 (May 2008) and 6.2 mg/L (May 2009), for a general mean of 1.6±1.1 mg/L. Extreme values are from spring time, while in summer the highest standard deviations are presented (Table 2). Seasonal variability show least values in autumn and maxima in spring season (Figure 3).
1.1.3 Variability in pink shrimp catches.
The maximum of captures of pink shrimp in Guacanayabo’s gulf was in 1976 (1187 t). After that there is a decline until a minimum in 2008 (3.0 t). However in 2009 an increase tendency is noted (22.0 t) in the gulf. The analysis of the historical series, indicates a clear improve in catches once any regulation policy (1983, 1990, 2001, 2008) has been accomplished (Figure 4).
.png)
Figure 4 Annual catches of pink shrimp in Guacanayabo’s Gulf from 1975-2009. Arrows indicate main handling fisheries policies to protect the fishing resource.Monthly mean catch of pink shrimp and monthly local cumulate raining in Guacanayabo’s Gulf
|
Both the annual capture andannualprecipitation(R²= -0.11; P=0.52) or monthly capture with monthly precipitation (R² = -0.15; P=0.002)do not correlated each other.
Total catches values per zone for 2008 and 2009 show higher values for the south region (zone III)in relation to the north (zone I and II). It is necessary to remark that in the zone II, at the north part of Guacanayabo’s Gulf, there wasa regulation fishing ban for thepink shrimpprotection due to the little values of biomass the years before (Figure 5).
.png)
Figure 5 Total catches (t) of the pink shrimp in three fishing zones in 2008 and 2009. Zone I and II belong to the North region and zone III to South region of Guacanayabo’s Gulf
|
1.2 Spatialvariabilityof water quality parameters
Spatial water temperature distribution was in agreement with seasonality and diurnal cycle influence. The isothermal lines allow discriminating higher values through the North region of the Gulf and from remote areas from river systems (Figure 6).Highest values and gradients were shown in summer, with lowest values in the interchange region among the gulf water and adjacent sea. On the other hand, the autumn reflected most homogeneity in horizontal distribution and lowest reported values (Figure 6).
.png)
Figure 6 Horizontal distribution of water temperature (?) in Guacanayabo´s Gulf in spring, summer and fall.Highest values are registered through the North East region and in remote zones from oceanic waters
|
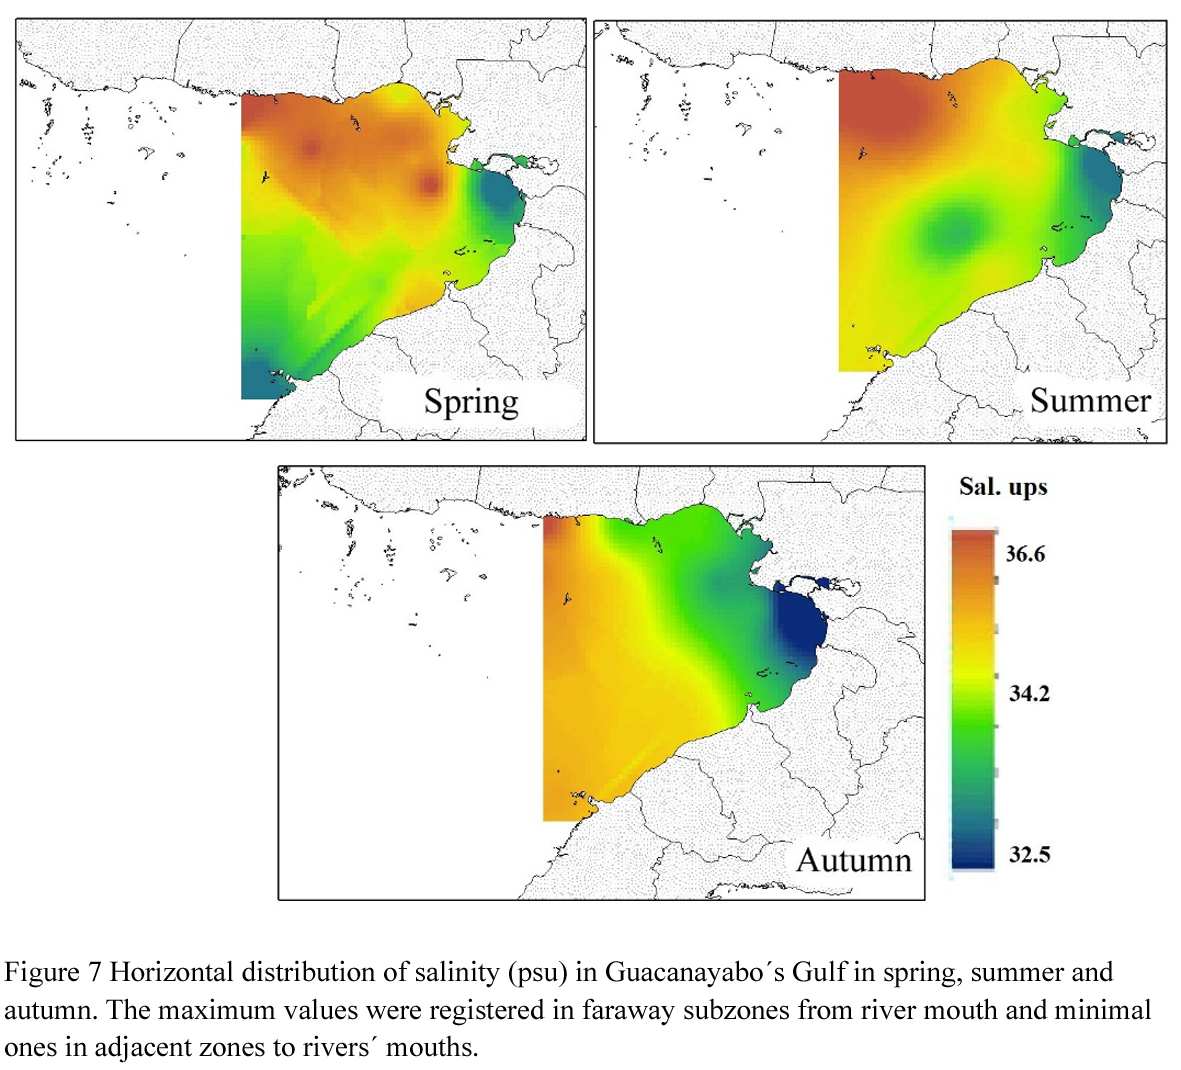
The horizontal salinity variation reveals a gradual increase of values through the North and Norwest regions (Figure 7). The maximum salinity values were found during spring season (dry season) in the subzones away from the mouth of the rivers and the open sea. Minimal salinities were registered in adjacent subzones to the mouth of the rivers and in fall (transition rainy- dry season), and that period showed highest variations in isolines (Figure 7).
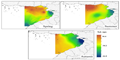
Figure 7 Horizontal distribution of salinity (psu) in Guacanayabo´s Gulf in spring, summer and autumn. The maximum values were registered in faraway subzones from river mouth and minimal ones in adjacent zones to rivers´ mouths
|
Spatial variability of dissolved oxygen indicates that during the sampling time, most of the platform waters reflect a relative uniform oxygenation (Figure 8). The maximum values ??are always displayed in the northern Gulf coast except in autumn, although the values ??were above 5.0 mg / L (Figure 8).
.png)
Figure 8 Horizontal distribution of dissolved oxygen (mg/L) in Guacanayabo´s Gulf in spring, summer and autumn. The maximum values are displayed in the North in spring and in the South in autumn, while the minimum are in the East
|
The isolines of higher values ??of COD are detected in spring, mainly in areas where there are the greatest influences of river runoff and anthropogenic wastes. On the other hand, lower values are registered in autumn and are located in the southern region of the gulf, where the adjacent waters allow a constant renovation of them (Figure9).
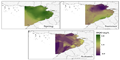
Figure 9 Horizontal distribution on chemical demand of oxygen (COD, mg/L) in spring, summer and fall. Maximum values are registered in zones with more runoff of rivers and anthropogenic wastes while, minimum ones are shown in renovation waters
|
2 Discusion
Water temperature values registered in situ, in Guacanayabo´s Gulf are similar to those previously described by Emilsson and Tápanes (1971). Seasonal variability of temperature, presents a relative thermal uniformity and maximum values in summer. This is due to the intense heat during this time, which corroborates the point of Emilsson and Tápanes (1971); Lluis-Riera (1977); Fernández-Vila (2006). In relation to the spatial distribution, this reflects a slight increase in the values ??of the isolines to the northern portion of the gulf, where the movement of water plays a decisive role (Fernández-Vila, 2006). In addition, the horizontal distribution of this factor is related to renewal processes by exchange with the ocean and water erogenous input, which coincides with that expressed by Emilsson and Tápanes (1971) and Lluis-Riera (1977).
Meanwhile, salinity showed a variability in relation to seasonality of precipitation and evaporation, and generally, with coastal runoff. This parameter had a general average lower than that obtained by Emilsson and Tápanes (1971) and Fernández-Vila (2006). The extreme values ??found are also lower compared with the data obtained by Lluis-Riera (1977). Taking into a consideration that the annual cumulate is similar to the historical average, the decrease in general salinity mean could be in relation to the displacement of the observed rainfall picks in the analyzed period. This change in climatic seasonality would generate a hydrological instability reflected in the variability of this parameter. The spatial distribution of salinity is determined mainly by the influence of precipitation and evaporation, as well as the renewal of shelf water with the adjacent ocean, evidence determined by Emilsson and Tápanes (1971), Lluis-Riera (1977), Fernández-Vila (2006). Therefore, despite the damming, there is an influence of runoff or underground freshwater, which prevents extreme values ??of salinity (Garcés and Betanzos, 2010).
In general, dissolved oxygen in the waters of Guacanayabo´s Gulf, was below the saturation concentration, which presupposes the Gulf as a system where the consumption processes predominated over the production processes. Only on special occasions, saturation was registered (> 100%), in spring (May) and autumn (September), mainly in the north and on the east coast, which can be induced to some extent by the presence of marine vegetation and strong waves waving waters caused by the wind from the south. Only the results obtained in summer (4.93 mg/L) were below the established criteria (5.0 mg/L) by the Cuban standard NC. 25 (1999) for good quality sea waters used for fishing. Hydrological conditions and variability of rainfall reveal the influence of erogenous water during the rainy season, as the maximum values ??are related to areas near the mouth of the river systems and coastal area of sea grass presence.
In the sampled period, the DO overall mean was low (82.16%) compared with this obtained by Lluis-Riera (1977), who suggested that the waters of Guacanayabo´s Gulf, have a uniform oxygenation and show an overall average of super saturation in throughout the year, mainly in the southern region. However, the results shown here are similar to those obtained by Fernández-Vila (2006). This indicates a progressive deterioration of the ecosystem, which has been reflected in the abundance and distribution of the pink shrimp. Considering that oxygen can limit metabolism through molecular dynamics and biochemical reaction rates, as well as govern the movement and distribution of aquatic organisms in their habitat (Fry, 1971), reduction in this parameter, mainly in breeding areas of the resource, could be an abiotic factor that limits recruitment, as reflected in reduced pink shrimp catch in this Gulf.
The increased availability of organic and inorganic matter evaluated by the COD, was found in the months of highest rainfall (spring), and in areas near the mouths of major river sources. The high content of organic matter that is dissolved or suspended, recorded by this parameter, coincide with lower isolines of dissolved oxygen, corroborating the seasonal runoff influence in the Gulf coast. The horizontal distribution of the COD shows, in general, variability related to seasonal rainfall and river nearby sources and also an anthropogenic influence. The Environmental Quality Standards (EQS, 2002) points out for seawater contaminated by organic matter, COD values ??≥ 3.00 mg/L. So taking into a consideration the overall average obtained, seasonal and space variability, the Guacanayabo´s Gulf waters are free of organic contaminants, except in raining months in which this marker is over the standards.
In general, this aquatic system shows low concentrations of dissolved or suspended organic matter and little anthropogenic influence, except for the east-central coast of the gulf, where values ??are emphasized in months of heavy rainfall, mainly in spring. Seasonal and annual averages obtained in this Gulf have GOOD quality index for fishing use, according to the Cuban International Standard NC-25 (1999). Although oxygenation of shelf waters reflects a decrease tendency compared with the results of Lluis-Riera (1977), is in the range of good quality for fisheries use.
The spatial and seasonal distribution of hydrological parameters, have a relationship with the seasonality of rainfall and evaporation. The biggest instabilities are showed in spring, while summer usually reflected better uniformity in its waters. The spatial distribution shows that the south has the lowest variations and better hydrological conditions. Coastal areas to the north and northeast of Guacanayabo´s Gulf showed greater freshwater influence, therefore, the largest seasonal variations, which agrees with the views expressed by Emilsson and Tápanes (1971) and also by Rodriguez (1983).
The spatial distribution of pink shrimp major catch areas in the Gulf, as determined by Giménez et al. (2012), coincide with the areas of greatest stability of hydrological markers (South-East). At the same time, lower abundance of the species, is obtained in the areas of greater variations and instabilities, higher values ??of COD and lower values ??of dissolved oxygen saturation. In the case of zone II, at the North part of the gulf, where the dissolved oxygen was high, the biomass was recovered in 2010 (1.9 t) after the protective ban. Nevertheless this value was smallest than the 7.03 t captured in zone III for the same year. On the other hand, generally speaking, the decrease in this fishing resource could be tightly related to the high fishing effort since the last century until the 2007, when a collapse in pink shrimp was produced.
Although not statistical comparison was made, there are slight changes in salinity and higher tendency of decrease of dissolved oxygen when compared with the literature reported valuesfor previous decades.The dissolved oxygen was the most variable marker, which indicates that in this aquatic system, there is a great alteration in water oxygenation. Those changes in hydrological markers could be influenced by the loss of marine vegetation in the coastal area (personal observation of the first author). Sea grasses are great promoters of productivity and biodiversity by their high primary production, and improve the quality of the marine environment to dampen wave energy and retain suspended particles in the water, thus improving transparency (Borum et al., 2004).Those hydrological changes, together with an over- exploitation of the marine shrimp, had influence in this negative trend of the catch of the resource in Guacanayabo´s Gulf.
On the other hand, the difference in the seasonal variability of hydrological parameters between the southern and northern region could be a factor influencing the spatial distribution of the pink shrimp abundance for each marine region.
3 Data and Methods
Mean monthly series of precipitations (mm) from 1974 to 2009 were used and from 2008 to 2009 of evaporation (mm) from Meteorological Station in Manzanillo.From data series, the monthly and annual mean were determined to establish the seasonal and interannual pattern in Guacanayabo’s Gulf. Besides, annual and monthly means were transformed in anomalies for a better graphic interpretation.
Marine environment sampling in Guacanayabo’s Gulf was made through a 17 network points (Figure 1). Samples were taken in situ both at surface (0.50 m) and bottom (0.50 m from the bottommost) and in all cases during the lighting day.Monitoring campaigns were made in 2008-2009 period, with a total of 11 expeditions: three of them in spring (April/May 2008 and May 2009), five in summer (June/July/August 2008 and June/July 2009) and three in autumn (September/November 2008 and October 2009). Water temperature (?), salinity (psu) and dissolvedoxygen were measured (mg/L), with a multiparameter probe HANNA HI 9828 (precision ± 0.01). Surface water samplings were taken with Van Dorn bottle and were conserved in 1 L recipients at -20 ?C and transported to the laboratory to be analyzed. Chemical Demand Oxygen (CDO) test were made by the Procedure to Marine Waters following (FAO, 1975) and expressed in mg/L.
Maximum and minimum mean values, as well as standard deviation of hydrological parameters were determined to make seasonality analysis and spatial distribution. Cuban Standardization NC.25:1999 criteria were taken into a consideration to evaluate obtained results.
Due to that samplings are punctual and do not cover all regions, for spatial distribution analysis, ArcGIS (10.1) program was used. It made possible to have graphic isolines representations of hydrological parameters.To develop contour maps, Kringing methodology was used because it is one of the main interpolation techniques (Isaaks and Srivastava, 1989; Cressie, 1990).
Commercial fishing data of catches (t) were used as well as cumulate raining (mm) from 1975 to 2009, obtained from Fishing Enterprise EPIGRAN (abbreviations from Spanish) and Meteorological Station of Manzanillorespectively. From data series, annual and monthly average values were calculated to determine the seasonal and inter annual pattern in the Gulf.
Comparison and regression analyses were performed between surface and bottom hydrological parameters. A simple correlation test among annual and monthly total catches of pink shrimp and cumulate raining was made using the program Statistica 6.0 (StatSoft, Inc. USA).
Acknowledgments
Authors are grateful to the workers and directives of Fisheries Industrial Enterprise of Manzanillo (EPIGRAN), for allowing the sampling work. To Dr. Enrique Giménez and BSc. Romina Alzugaray for helpful comments and remarks. Special thanks to anonymous reviewers for improving the quality of the manuscript.
Author’s contribution
YG conceived of the study, designed the station network, collected the data and analyzed it. AA helped in data analyzes. YGand AA drafted the manuscript. MJMF critically revised the manuscript giving substantial changes. All authors read and approved the final manuscript.
Borum J., Duarte C. M., Krause-Jensen D., and Greve T., 2004, European seagrasses: an introduction to monitoring and management, The M&MS Project, Copenhagen, pp 187
http://www.seagrasses.org
Emilsson I., and Tápanes J. J., 1971, Contribution to the hydrology of the South Shelf of Cuba (In Spanish),Serie Oceanológica No. 9
FAO 1975, Manual of methods in aquatic environment research part I, Methods for detection measurement and monitoring of water pollution, FAO Fish, Tech. Pap N° 137
Fernández-Vila L., 2006, Oceanographic basis to study climatic global changes influence in Cuban marine biodiversity, Project: “Global changes and Evolution of Cuban Environment”, GEOCUBA Archive, Marine Studies, Environmental Agency, Havana, pp 154 (In Spanish)
Font L., 2000, Decrease of the impact of shrimp trawling fisheries over alive fishing resources through environmental protective techniques. (In Spanish), (EO/INT/724/GEF) Regional Workshop, Costa Rica, 12 -14 January 2000
Fry E.J., 1971, The effect of environmental factor on the physiology of fish. In: Hoar W.S., and Randall D.J., (ed.) Fish Physiology VI (Environmental relations and behaviour), Academic Press, New York
Garcés Y., and Betanzos A., 2010, Effects of river basins’ supply in salinity and nutrients in Guacanayabo’s Gulf, Cuba, in rainy months of 2008 and 2009 (In Spanish), E-repository Of Ocean Docs Publications, http://www.oceandocs.org/handle/1834/3628, Fisheries Research Centre, VI Internacional Workshop CONyMa 2010, Havana 2010
Giménez E., Garcés Y., Ventura A., Delgado G., and Alfonso S., 2012, Current state of pink shrimp (Farfantepanaeus notialis) in Guacanayabo’s Gulf, Cuba (In Spanish), Ecovida, RNPS: 2178, Tomo 3, Folio 126, ISSN 2076 - 281X
Isaaks E.H., and Srivastava R.M., 1989, An Introduction to Applied Geostatistics, Oxford University Press, New York
Lluis-Riera M.L., 1977, Hydrological Studies of south-east Cuban shelf and adjacent oceanic waters (In Spanish), Acad. Cien. Cuba, 16: 1-29
N.C. 25: 1999. Evaluation of hydrological objectives for Fishing Use (In Spanish), Standardized System for environment protection, Hydrosfere, Republic of Cuba
Pérez I.E., Arencibia G., Capetillo N., and Isla M., 2003, Influence of White shrimp culture(Litopenaeusschmitti) over coast ecosystems(In Spanish),Rev. Fopcana, 2 (1-2): 11-20
Rodríguez E., 1983, Correlations between water temperature and wind velocity in Cuban South –East shelf (In Spanish), Rev. Cub. Inv. Pesq., 8(4): 62-72
Sosa M., 2000, Shrimp trawling fisheries in Cuba, (In Spanish) In Regional shrimp Workshop. Regional Workshop, Costa Rica, 12 -14 January 2000(EP/INT/724/GEF)
Sosa M., 2003, Recruitment and current state of pink shrimp (Farfantepenaeus notialis), in Guacanayabo’s Gulf, Cuba (In Spanish), Rev. Cub. Inv. Pesq., 23 (1): 77-82. ISSN 0138-84

.png)
.png)
.png)
.png)
.png)
.png)


