Does Primary Productivity Affect Benthic Macroinvertebrate Abundance and Diversity in Estuarine Ecosystem? A Case Study in Lagos Lagoon, Nigeria 
 Author
  Correspondence author
International Journal of Marine Science, 2014, Vol. 4, No. 42 doi: 10.5376/ijms.2014.04.0042
Received: 31 Mar., 2014 Accepted: 15 May, 2014 Published: 11 Jul., 2014
Uwadiae, R.E. and Ajose, A.A. 2014, Does Primary Productivity Affect Benthic Macroinvertebrate Abundance and Diversity in Estuarine Ecosystem? A Case Study in Lagos Lagoon, Nigeria. International Journal of Marine Science, Vol.4, No.39 1-11 (doi: 10.5376/ijms.2014.04.0039)
Whether the level of primary productivity as expressed in the concentration of chlorophyll a (chl a) in water and sediment affect the abundance and diversity of benthic macroinvertebrates in an estuarine ecosystem was investigated using data generated from a six month study in the Lagos Lagoon, Nigeria. Overall trends in physical variables were relatively inconsistent for study sites. Water transparency varied between 3 – 32 cm with highest and lowest values recorded in stations 1 and 3 respectively. Turbidity values varied inversely as transparency and directly with depth. Values were lowest in station 1 and highest in station 3. Two major macroinvertebrate groups (Annelida and Mollusca) made up of eight species were identified from a total density of 7820 ind/m2. Mollusca were the most abundant group with a density of 7800 ind/m2 and accounted for 99.7 % of the total macroinvertebrate density. Significant difference (ANOVA, F = 8.282, p > 0.05) was observed in the density of benthic macroinvertebrate recorded in study stations. Of the eight species recorded, six occurred in all the study stations while the remaining two species were limited to station 1 (for Neritina glabarata) and stations 1 and 2 (for Nereis lamellose). Generally, values of chl a were higher in water samples than in sediment. The concentrations of chl a in water during the study months were significantly different (ANOVA, F = 8.883, p < 0.05), and significantly lower in the month of February and highest in the month of March. Total concentration of chlorophyll a in water was highest in station one and lowest in station two. Values of chl a in sediment was also significantly different (ANOVA, F =1.927, p > 0.05) during the sampling months with values highest in the month of March.. Relatively higher values of chl a in sediment was recorded in station 2. There was significant and positive correlation between macroinvertebrate density (rs= 1; p <0.01), diversity (rs= 1; p < 0.01) and chl a in water. However, there was negative correlation between macroinvertebrate density (rs= 0.43; p > 0.01), diversity (rs= 0.45; p > 0.01) and chl a in sediment. Transparency of water correlated positively and significantly with chl a in sediment (rs= 1; p < 0.01) and water (rs= 0.8; p < 0.01). Turbidity and depth of water related negatively but significantly with chl a in water and sediment. Results obtained in this study suggest that primary production may influence benthic macroinvertebrate abundance and diversity in estuarine ecosystems.
Introduction
Primary producers form the basis of ecosystems by transferring the energy in sunlight or inorganic compounds into the chemical energy stored in sugars. Net primary productivity results in biomass. In every aquatic ecosystem, the chemical energy in primary producers eventually moves to one of two types of organisms; primary consumers or decomposers. Primary consumers are a key link to the grazing food web. Not all plant tissues are consumed by herbivores, however. Tissues that are not consumed eventually die. When they do, they enter the decomposer food web, which is composed of species that eat the dead remains of organisms (Scot, 2005).
Productivity in coastal water bodies such as estuaries is higher than those of the deep open ocean. This stems from the fact the neritic and intertitidal zones along coasts receive nutrients from two major sources (Scot, 2005): 1) Rivers that carry and deposit nutrients from terrestrial ecosystem and 2) Near-shore ocean currents that bring nutrients that have rained down into the cold, deep water of the oceanic zone back up the surface. Both of these sources are absent in the surface waters of the open ocean. In addition, nutrients found in organisms near the surface of the open ocean where light is abundant constantly rain down to dark, deeper waters in the form of dead cells and are lost.
Microalgae play an important role as primary producers. Primary production of organic compounds is the main food source for benthic fauna and contributes in no small measure to the abundance and diversity of macroinvertebrates (Guillard, 1975; Pinckney and Sandulli, 1990; Kang et al. 2003; Pinckney et al. 2003). Primary production contributes to a substantial proportion of the energy flow in estuarine systems. Benthic microalgae for instance, are of great ecological importance since they contribute considerably to primary productivity available to both the benthic and the pelagic community. In addition to supplying food resources, microalgae excrete high molecular weight polysaccharides that contribute to sediment stabilization and reduce sediment resuspension during both tidal emergence and storms (Herman et al. 1999).
Chlorophyll is a reliable index of microalgae biomass. Chlorophyll a pigments have proven useful in explaining localized patterns of biodiversity (Pinckey et al., 1994). Primary production can be estimated from analysis of chl-a in surface waters (Daemen, 1986; Cole and Cloern, 1987). The Chlorin Index (CI) (Schubert et al. 2005) which is a measure of the amount of chlorophyll and its degradation products that could be transformed to phaeophytin, has been used as a geochemical surrogate of biodiversity. Chlorophyll content is a measure of phytoplankton and microphytobenthos (MPB) biomass which are the main primary producers in estuarine environment (MacIntyre and Cullen, 1995). The productivity of benthic algae is dependent on various environmental variables such as availability of light, emersion periods during tidal cycle, etc. Various researches on estimation of benthic algal biomass in estuarine and mud flats have been carried out in the past (Underwood and Kromkamp, 1999; Murphy et al., 2008), and in most of the studies, the biomass of MPB is often expressed as chl-a, which is widely distributed and the most abundant pigment component in most species of microalgae hence is used to estimate micoalgal biomass (Sun et al., 1994). Benthic microalgae are known to be extremely variable and exhibit spatial and temporal heterogeneity (Platt et al., 1980). In sediments and water column, chlorophyll content is reported to vary both horizontally and vertically (Colijn and de Jonge, 1984; Pinckney and Sandulli, 1990; Buffan-Dubau and Carman, 2000; Murphy et al., 2008).
Macroinvertebrates are important part of the aquatic food chain. Benthic invertebrates play important roles in transitional ecosystems, by filtering phytoplankton and then acting as a food source for larger organisms such as fish, thereby linking primary production with higher trophic levels. These macoinvertebrates acquire their food in a variety of ways. The general behavioral mechanisms of food acquisition in different species can result in the ingestion of a wide range of food items (Merritt et al., 1996). Scrapers (grazers), consume algae and associated material; shredders, consume leaf litter or other coarse particulate organic matter (CPOM), including wood; collectors (gatherers), collect fine particulate organic matter (FPOM) from the stream bottom; filterers, collect FPOM from the water column using a variety of filters; and predators, feed on other consumers. The deposit feeders include those that selectively feed on the surface deposits and those that ingest surface and subsurface deposits indiscriminately.
The food supply of the benthic macroinvertebrates directly or indirectly, depend almost entirely from living and dead particulate matter sinking from the overlying water (Dudley et al. 1986; Herman et al. 1999). Microalgae in the surface water and sediment form a primary food source which supports many benthic macroinvertebrates. Detrital matter derived from primary productivity also constitute a valuable resource for benthic macroinvertebrtaes and make up the only energy input to the aphotic zone (Middlelburg et al. 1996; Herman et al. 1999; Kendrick et al. 1998; Kang et al., 2003). It is generally accepted that the flux of particulate organic carbon (POC) from the euphotic zone controls the biomass and abundance of deep-sea benthos.
Benthic communities play a critical role in the functioning of estuaries. Chlorophyll composition and benthic consumers are essential components of coastal ecosystems (MacIntyre et al., 1996) influencing sediment biogeochemistry via uptake and release of nutrients (Kang et al. 2003), and sediment erosion via their production of exopolymers (Pinckney et al., 1994), hence an attempt to establishing the relationship between them is worth an ecological adventure.
Very little is known about the distribution of chlorophyll in the Nigerian aquatic system, and apparently no attempt has been made to relate primary production to the abundance and diversity of benthic macroinvertebrates. The main objective of this present paper is to determine whether primary productivity expressed as concentration of chl-a in sediment and surface water directly affects the abundance and diversity of benthic macroinvertebrates. This will provide the needed information in the understanding of ecosystem functioning and buttress the underlying principles relating to plant-animal interaction in estuarine ecosystems.
1 Materials and Methods
1.1 Description of study area
The Lagos Lagoon is located in the heart of the Lagos metropolis, occupying the southern part of the metropolis, linking the Atlantic Ocean in the west and south through the Lagos Harbour, and connecting with Lekki and Epe Lagoons in the east. It is about 6,354.788 sq km in area and 285 km in perimeter. The lagoon sediment range from mud, sandy mud, muddy sand, to sand (Ajao and Fagade, 1991). It is generally between 0.5 - 2 m deep in most parts with a maximum of about 5 m in the main lagoon and 25 m in some dredged parts of the Lagos Harbour. The lagoon serves as means of recreation, transport, and a dumpsite for residential and industrial discharges. It also serves as a natural shock absorber to balance forces within the natural ecological system.
More than 60 % of the industries in Nigeria are located in Lagos State and they all discharge their effluents directly or indirectly into the Lagos Lagoon. Most of the effluents discharged are untreated as many of the industries do not have treatment plants. In addition to wastewater from industries, there are domestic sewage discharges, garbage and wood shavings from sawmill depots along the shores of the lagoon. The proliferation of urban and industrial establishments along the shores of the lagoon has resulted in a complex mix of both domestic and industrial wastes which eventually find their way into the lagoon (Ajao, 1996).
The Lagos lagoon system consists of three main segments namely; the Lagos Harbour Segment, the Metropolitan Segment and the Epe Segment. Commercial and industrial activities are mainly concentrated in the Metropolitan Segment (Ajao, 1996). There are both spatial and seasonal differentials in the salinity of the lagoon due to the effect of Atlantic Ocean and rainfall pattern (Webb, 1958). Seasonal and diurnal salinity fluctuations are greatest in the Lagos Harbour Segment of the lagoon because the influx of water from Atlantic Ocean and the lagoon at different times of the day and year. This salinity decreases as distance increases from Atlantic Ocean.
Apart from waste discharged into the lagoon, Lagos Lagoon is also faced with a lot of human pressure such as sand filling and dredging, general habitat destruction and unregulated fishery exploitation. These have resulted in the general biodiversity reduction in the lagoon as reported in previous studies (Nwankwo and Akinsoji, 1999) on the lagoon biota.
Three sampling stations (Figure 1) from the Metropolitan Segment were selected for this study and care was taken in selection of the study stations to adequately represent true estuarine conditions.
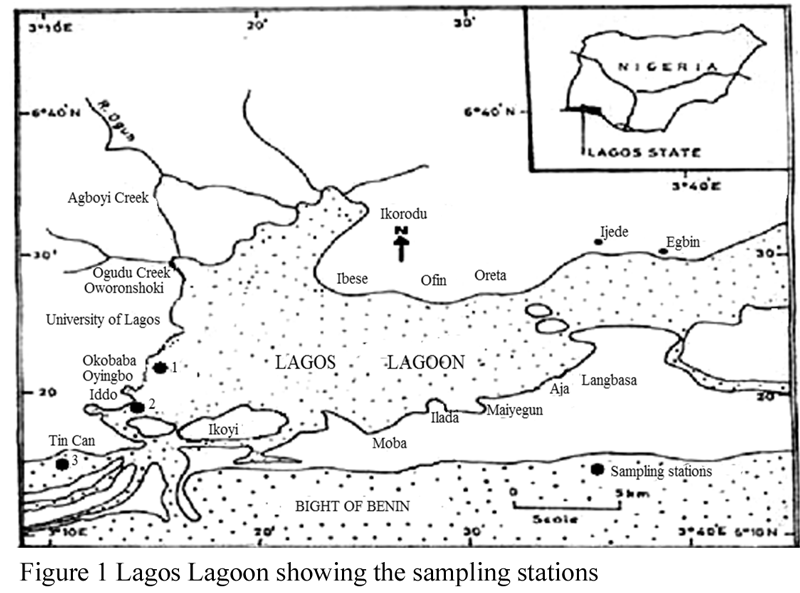 Figure 1 Lagos Lagoon showing the sampling stations |
Station 1 is the Okobaba (6o34′24′′N and 3o31′52′′E), this part of the lagoon is known for its wood waste which is indiscriminately released into the lagoon. Tidal influence is strong in this area of the lagoon. Colour of the water was brownish green and sediment colour was black. Station 2 is located at the Iddo (6o47′36′′N and 3o27′29′′E) area of the lagoon. Most notable human activity here is sewage dump. Station 3 is at the Tin Can Island Port slightly adjacent the Lagos Harbour (6o52′19′′N and 3o43′41′′E). Colour of the water was brownish green and sediment colour was black. The texture of the sediment collected in this station was muddy. Boating activities is a major feature of the study area.
1.2 Data collection and laboratory analyses
Depth of study stations was measured using a graduated wooden pole while water transparency was determined using a 20 cm diameter Secchi Disk painted black and white. Turbidity of water samples was determined according to the methods described in APHA (1998). From each station, samples of benthic macrofauna were taken in three replicates with a van Veen grab of 0.1 m2 in area. Samples were washed through a sieve of 0.5 mm mesh size and organisms retained by the sieved were collected in sample containers and preserved with 10 % formaldehyde solution in situ. Water samples for chl-a analysis were collected in BOD bottles and corked properly while samples of sediment for chl-a analysis were collected in BOD bottle and resuspended with water from the site. In the laboratory fixed benthic samples were washed with tap water to remove the fixative and any remaining sediment and other debris for easy sorting. The animals were sorted into different taxonomic groups using suitable identification manuals including Edmunds (1978) and Barnes (1988). The numbers of taxa and individuals for each station were counted and recorded for all the sampling months. Chlorophyll samples were filtered through Whatman glass-fibre filter and extracted in acetone in the dark and under refrigeration (Holm-Hansen, 1978; Daemen, 1986). Chlorophyll a was determined fluorometrically.
1.3 Statistical analysis
One-Way analysis of variance (ANOVA) was used to determine variations in environmental conditions at the study stations. When significant variations are detected, a post hoc test using Duncan New Multiple Range Test (DMRT) in the case of physico-chemical variables and Turkey’s Test in the case of biotic variables were performed to determine the locations of significant differences. The following ecological parameters were assessed to describe the structure and composition of benthic macroinvertebrates; density = number of individuals per 0.1 m2 (ind/m2), diversity = number of species of benthic macroinvertebrates.
2 Results
2.1 Physical environmental factors
Summary of physical conditions in the study sites is presented in Table 1. Overall trends in variables investigated were relatively inconsistent for study sites. Water transparency was highest in station 1 where a range of 3 – 6 cm and a mean value of 88.8 cm were recorded. In station 2, the value of transparency varied between 9.3 and 32 cm and a mean of 23.46 was observed. Transparency in station 3 was lowest, ranging between 8 and 23 cm with a mean value of 14.0 cm.
Table 1 Summary of physical conditions at the study sites |
In contrast to the pattern displayed by transparency, turbidity values were lowest in station 1 and highest in station 3. In station 1, a range of 28 – 80 NTU and a mean value of 50.85 NTU were recorded, while values observed for stations 2 and 3 ranged from 10 to 70 NTU (mean = 54.5 NTU) and between 3 and 180 NTU (mean = 69.67 NTU) respectively were recorded. The depth of the study stations varied directly with the turbidity. While a mean value of 173.16 cm was measured in station 1, higher values of 196.16 cm for station 2 and 317.5 cm for station 3 were recorded.
2.2 Community structure of benthic macroinvertebrates
Two major macroinvertebrate groups (Annelida and Mollusca) were identified from a total density of 7820 ind/m2 benthic macroinvertebrate in the study area. Mollusca was the most abundant group with density of 7800 ind/m2 (comprising 65% gastropoda and approximately 35% of bivalves) and accounted for 99.7% of the total macroinvertebrate density. It was represented by 2 classes, 4 families and 7 species. Among the molluscs observed, the estuarine gastropod Pachymelania aurita was the most abundant with a density of 2540 ind/m2 and accounted for 33% of molluscan population. Also significantly represented in the molluscan group is another estuarine gastropod Tympanotonus fuscatus which accounted for 23.2% (density 1810 ind/m2) of mollusc population. Other gastropods recorded include T. fuscatus var radula (7%; 540 ind/m2) and Neritina glabarata (1%; 80 ind/m2). Among the bivalves Tellina nymphalis (13 %; 990 ind/m2) dominated in abundance while Aloides sp (11 %; 840 ind/m2) ranked second and Macoma cumana constituting 10.89% with a population density of 820 ind/m2 was the least contributor. Annelida was represented by 20 specimens (Constituting 200 ind/m2) of Nereis lamellose and accounted for 3% of the total benthic macroinvertebrate population.
2.3 Spatial and temporal variations in density and diversity of macroinvertebrates
High variability in fauna density and diversity at spatiotemporal scales was observed in this study (Figures 2~5). Although there was no significant difference (ANOVA, F = 0.722, P < 0.05) in the monthly density of benthic macroinvertebrates recorded, significant difference (ANOVA, F = 8.282, P > 0.05) was observed in the density of benthic macroinvertebrate recorded in study stations. A post-hoc test using Turkey’s Test shows that density of benthic macroinvertebrates were significantly higher and similar in stations 1 and 3 than station 2. Of all the stations used for this study, station 1 recorded the highest density (410 ind/m2) and number (8) of species, while stations 2 and 3 recorded 105 ind/m2, seven spp and 270 ind/m2, six spp respectively.
.png) Figure 2 Variation in density of benthic macroinvertebrates in the study stations during the dry season |
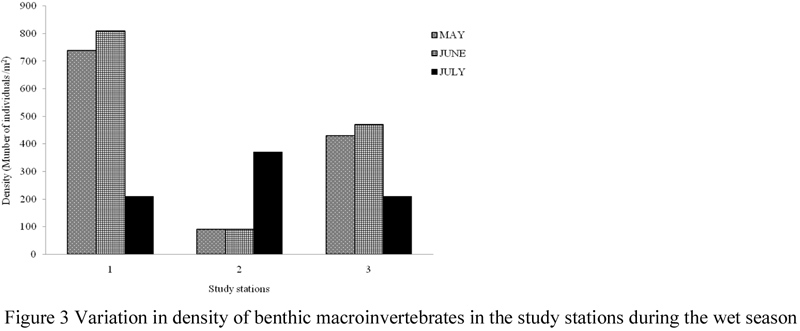 Figure 3 Variation in density of benthic macroinvertebrates in the study stations during the wet season |
 Figure 4 Variations in the number of benthic macroinvertebrtae species recorded at the study stations during the dry season |
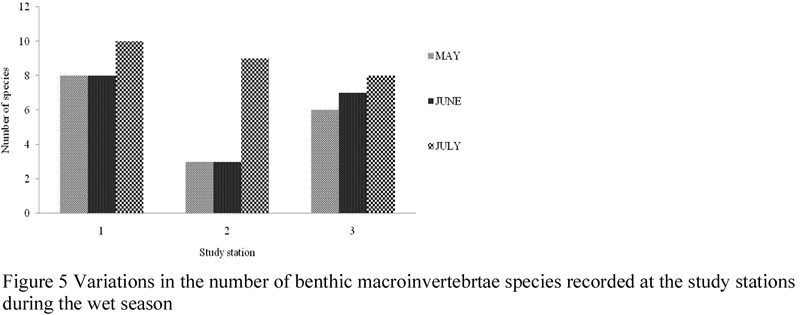 Figure 5 Variations in the number of benthic macroinvertebrtae species recorded at the study stations during the wet season |
Analysis of the spatial occurrence of the species observed (Figure 6) indicates that only six spp (P. aurita, T. fuscatus, T. fuscata var. radula, Aloides sp., T. nymphalis, M. cumana) occurred in all the study stations. Nereis lamellose was restricted to stations 1 and 2, while Neritina glabarata occurred only in station 1. All the species recorded highest densities in station 1 (except N. lamellose which occurred in greatest number in station 2). Generally, individual species representation was lowest in station 2. Although, differences in spatial distribution were clearly evident, that cannot be said of the seasonal density.
.png) Figure 6 Spatial variation in density of benthic macroinvertebrate species |
2.4 Structure of functional feeding groups (FFGs)
Analysis of the functional feeding composition of the macroinvertebrate assemblage revealed that, of the two FFGs (Table 2) recorded, filter feeder was the most abundant FFG, it accounted for 67.4 % of the total benthic macoinvertebrate population, while the deposit feeders constituted 30.05 %. A predatory species Nereis lamellose which constituted 2.56 % of the total population was recorded. The population of the filter feeders was dominated by the gastropod P. aurita, which accounted for approximately 48 % of the observed population; this was followed by T. nymphalis which constituted 18.78 %.
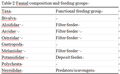 Table 2 Faunal composition and feeding groups |
Filter feeders were recorded in all the study stations, however, N. glabarata was absent in stations 2 and 3, and the predator was not recorded in station 3. Densities of filter and deposit feeders were highest in station 1, while that of the predator was highest in station 2.
2.5 Spatial temporal variations in primary productivity
The concentrations of chl-a in surface water and sediment of the study area are presented in Table 3, while Figures 7~11 illustrate its spatial and temporal variations during the study period. Generally, values of chl-a were higher in water samples than in sediment. The amount of chl-a in water was highest (5.06 mg/L) in the month of March and lowest (0.9 mg/L) in the month of February. Total chl-a values recorded for the other sampling months were; 2.47 mg/L in July, 2.43 mg/L in June, 2.15 mg/L in May and 2.06 mg/L in April. The concentrations of chl-a in water during the study months were significantly different (ANOVA, F = 8.883, p < 0.05), a post-hoc test using Turkey’s Test shows that values of chl-a were significantly lower in the month of February and significantly highest in the month of March, while values recorded for the months of April, May, June and July were similar. Monthly values varied between 0.12 – 0.46 mg/L in February, 1.13 – 2.01 mg/L in March, 0.53 – 0.89 mg/L in April, 0.57 – 0.89 mg/L May, 0.61 – 0.98 mg/L in June, and 0.53 – 1.01 mg/L in July. There was variation in values of chl-a recorded in the study stations, although values were not significantly different (ANOVA, F = 0.005, p > 0.05). Total concentration of chl-a in water was highest in station 1 and lowest in station 2.
Table 3 Summary of values of chl-a concentration in the study area |
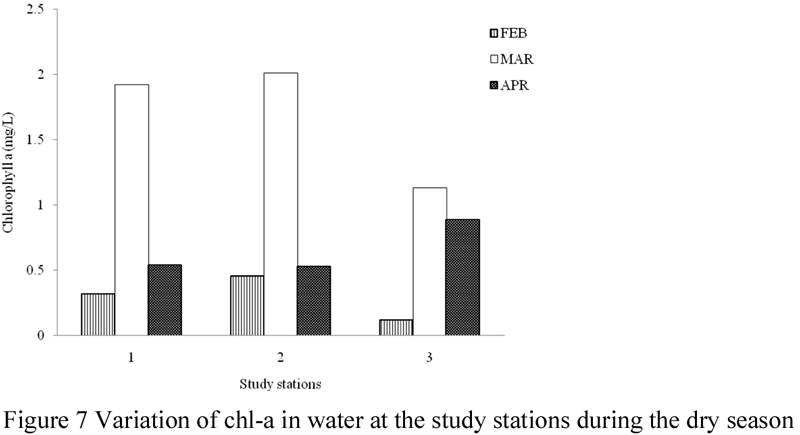 Figure 7 Variation of chl-a in water at the study stations during the dry season |
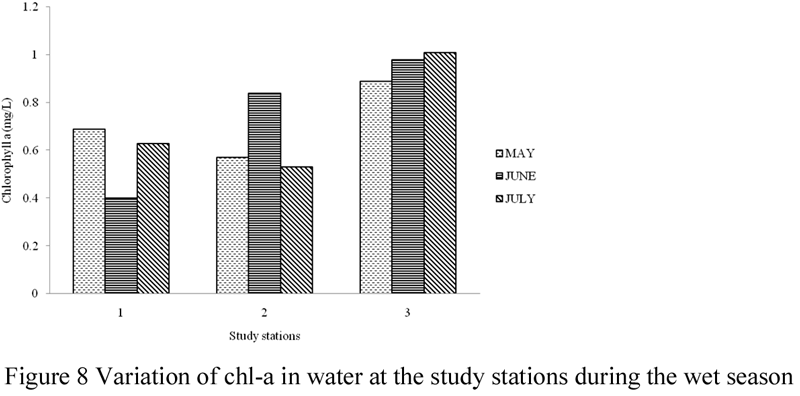 Figure 8 Variation of chl-a in water at the study stations during the wet season |
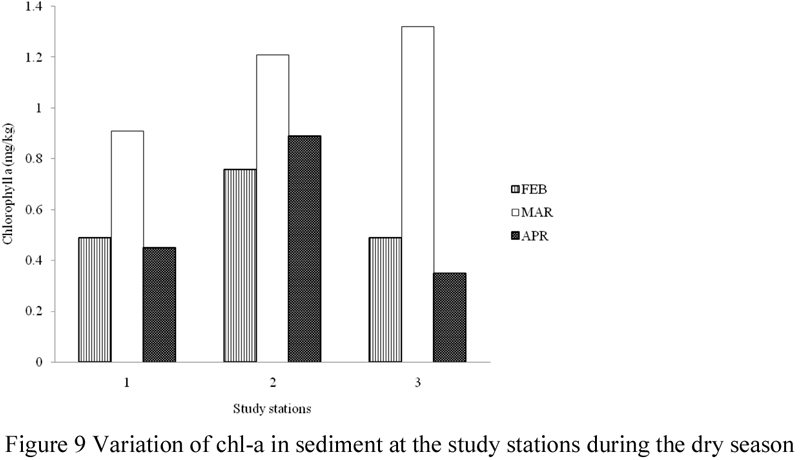 Figure 9 Variation of chl-a in sediment at the study stations during the dry season |
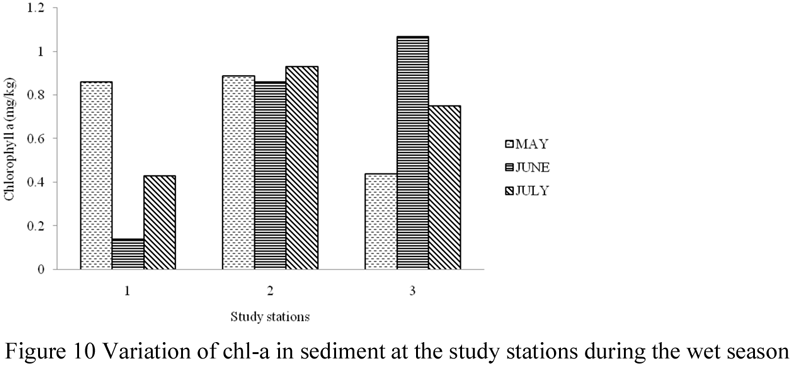 Figure 10 Variation of chl-a in sediment at the study stations during the wet season |
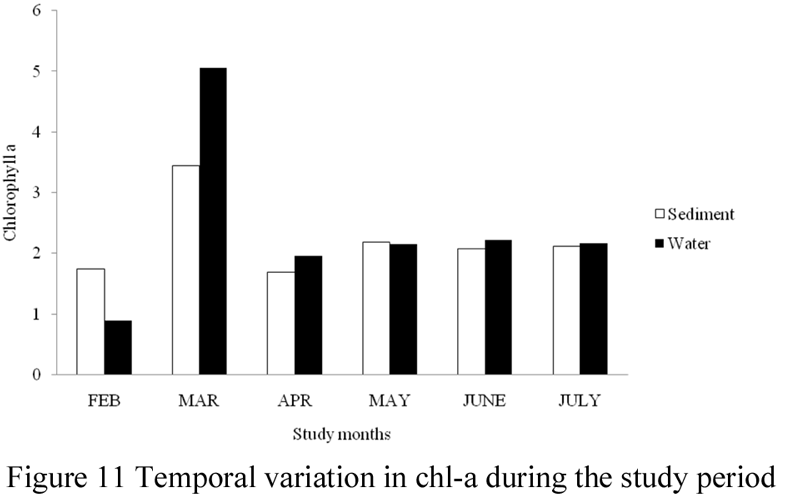 Figure 11 Temporal variation in chl-a during the study period |
The amount of chl-a in sediment was highest (3.44 mg/g) in the month of March and lowest (1.99 mg/g) in the month of April. Total chl-a values recorded for the other sampling months were; 2.14 mg/g in February, 2.11 mg/g in May, 2.57 mg/g in June and 2.32 mg/g in July. Monthly concentrations of chl-a in sediment in the study area varied between 0.49 – 0.89 mg/g in February, 0.91 – 1.32 mg/g in March, 0.35 – 0.89 mg/g in April, 0.44 – 0.86 mg/g May, 0.64 – 1.07 mg/g in June, and 0.53 – 0.93 mg/g in July. Chl-a in sediment was significantly different (ANOVA, F =1.927, p > 0.05) during the sampling months, with values significantly lower in the months of February, April, and May, but significantly higher in March, June and July. However, values of chl-a in sediment were not significantly different at the study stations (ANOVA, F = 0.790, p > 0.05).
2.6 Relationship between chl-a and faunal variables
Spearman's correlations between chl-a and faunal attributes in the study area (Table 4) indicated that there was significant and positive correlation between density (rs = 1; p < 0.01), diversity (rs= 1; p < 0.01) and chl-a in water. However, there was negative correlation between density (rs= 0.43; p > 0.01), diversity (rs = 0.45; p > 0.01) and chl-a in sediment. Among the physical factors studied, only transparency of water correlated positively and significantly with chl-a in sediment (rs=1; p < 0.01) and chl-a in water (rs = 0.8; p <0.01). Turbidity and depth of water related negatively but significantly with chl-a in water and sediment. In general, the result of this study demonstrated that chl-a composition affected the faunal variables while physical attributes investigated had major influence on chl-a concentration.
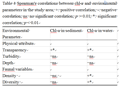 Table 4 Spearman's correlations between chl-a and environmental parameters in the study area |
3 Discussion
Overall trends in physical variables were similar to those previously recorded for the Lagos Lagoon and some estuarine water bodies in Nigeria (Brown, 2000; Ogunwemo and Osuala, 2004). The result of the correlation analyses between physical factors and chl-a concentration revealed the interplay of factors that may have determined the overall pattern in the results obtained. Transparency related positively and significantly with chl-a in water and sediment, while turbidity and depth correlated negatively with chl-a in water and sediment. These observations are in agreement with the report of earlier workers (Marra, 1978; Platt et al. 1980; Pinckney and Zingmark, 1993; MacIntyre and Cullen, 1995). According to Marra (1978), primary production by phytoplankton is known to be influenced by transparency of water, turbidity and depth. Variability in these factors may be due to several factors such as, the daily and seasonal cycles of incident irradiance and interactive changes in biological and physical characteristics of the water column.
The effects of turbidity and transparency of water on chl-a in estuarine ecosystems have been widely studied (Jennes and Duineveld, 1985). The effect of turbidity on chl-a is more of a shorter time-scales than the effect of the externally imposed daily changes in transparency of water (Garrad and Hey, 1987). The magnitude of the effect of changes depend on the mechanisms that drive them, and their effect on overall rates of primary production depends on the degree to which, they influence the co-occurrence of chl-a and light. Turbidity in estuarine waters is determined largely by the concentration of suspended sediments (Cloern, 1987) and can change with tidal frequency, either because of advection of water masses with differing loads of seston or because changes in current velocity cause alternating episodes of suspension and deposition of sediment (Cloern, 1987). Resuspension is also caused by wind-driven mixing (Cloern, 1987) and by boat traffic (Garrad and Hey, 1987) which is a common activity in the study area. The frequency with which water clarity varies may be tidal or sub-tidal, depending on the relative influence of tides and winds. This variability is superimposed on the day/night cycle in determining the amount of light to which phytoplankton suspended in the water column are exposed (Marra, 1978; Baillie and Welsh, 1980).
Variability in the concentration of chl-a may be due to advection of patchily distributed populations, resuspension of benthic assemblages and/or changes in the balance between growth and grazing. Resuspension of benthic microalgae has been identified as the major cause of the variability in chl-a concentration in shallow estuaries (Sullivan and Moncrieff, 1988; de Jonge and van Beusekom, 1992). Productivity in the water column of turbid estuaries may even be dominated by resuspended benthic algae (Shaffer and Onuf, 1985, de Jonge and van Beusekom, 1992). Further variability in suspended chl-a on diel time-scales may be due to a change in the balance between grazing and the growth of suspended microalgae (Cloern, 1987). The dominant frequencies of change in chl-a concentration are therefore the same as those of changes in the clarity of the water column. Both vary on shorter time-scales than the diel variability associated with the daylight cycle.
Overall monthly values of chl-a in sediment varied from 1.99 to 3.44 mg/g, with the highest concentration recorded in the dry season (March), highest values of chl-a in water was also recorded in the same month. This result is expected since in the dry season turbidity is lower and transparency higher owing to the water clarity due to reduced flooding associated with the wet season which brings a lot of debris into the lagoon. The overall values of chl-a in water was higher than that recorded for sediment. This is also expected since the higher amount of radiation reaching the surface water is likely to engender more photosynthetic activities than in sediment that receives lower amount of radiation. The effect of this variability on productivity depends on the covariance of changes in, turbidity and microalgal biomass and on any changes in the photosynthetic responses of the microalgae (Baillie and Welsh, 1980). Resuspension of sediment alone would cause a drop in system level productivity because of the decrease in light availability. This depression can be offset where photosynthetically-competent benthic algae are resuspended in association with the sediment because an increase in algal biomass compensates for the decrease in light availability. Covariance between changes in chl-a and turbidity has been shown in several studies including Murphy et al. (2008).
Analysis of the data recorded for macroinvertebrate shows that the amount of chl-a may affect the abundance and diversity of benthic macroinvertebrates in an estuarine ecosystem. Most of the correlation analyses carried out between concentration of chl-a and parameters of benthic macroinvertebrates indicated different levels of relationship. Concentrations of chl-a in water and sediment affected the density and diversity of benthic macroinvertebrates differently. While sediment chlorophyll correlated negatively with density and diversity of benthic macroinvertebrates, both parameters were positively and significantly correlated with chl-a in water (See Table 3). Dudley et al. (1986) reported that effects of measures of productivity such as algae production as represented by chl-a concentration on benthic maccroinvertebrates may be “positive” resulting in increasing measures of macroinvertebrate communities or populations with increasing algae or “negative” decreasing macroinvertebrate community/population measures with increasing algae. Maasri et al. (2008) showed that the concentration of chl-a is important in explaining variation in chironomid community composition and the abundance of certain chironomid populations in Mediterranean streams.
Effects of benthic chl-a on macroinvertebrates may be summarized as follows. Positive effects may include: Increased habitat structure (attachment space, predation refuges, etc.); increased food resources (epiphytes or macroalgae; filamentous algal mats trap additional fine particulate organic matter). Negative effects may include: Disruption of habitat (smothering); competition for space with invertebrates; interference with feeding or other behavior (direct physical effects; alteration of current flow patterns); water quality changes (reduced dissolved oxygen [DO]; increased variation in water quality) as well as production of toxins (Cyanobacteria).
Steigerwalt (2005) found that macroinvertebrate community diversity (Shannon-Wiener Index, H’) and community evenness (Pielou’s evenness, E) declined significantly with increasing algal biomass on Ichetucknee River snag habitat. Her data indicate that taxa richness increased with algal biomass, the decline in diversity was observed to be due to the reduction in evenness. This indicates that increased algal biomass results in a less diverse benthic macroinvertebrate community due to increased dominance by a few invertebrate taxa better adapted to exploit the algal habitat. These observations corroborate the findings of this present study. The significant positive relationship between density and diversity of macroinvertebrates and chl-a in water shows that higher phytoplankton production is likely to result in larger amount of materials available for the benthic filter feeders, while the negative correlation displayed by the two parameters with chl-a in sediment suggests that large algal biomass may result in detrimental effects on benthic macroinvertebrates.
Trophic metrics are surrogates of complex processes such as trophic interaction, production and food source availability (Merrit et al. 1996). Feeding strategies are typical traits reflecting the adaptation of species, and they could form part of a unified measure across communities differing in taxonomic composition (Statzner et al. 2004). Various modes of food acquisition have been described (Cummins and Merritt, 1996) in the form of functional feeding groups which have been used to describe lotic invertebrate feeding habits, and have been used to assess ecosystem condition (Merritt et al. 1996) The percentage representation of all the feeding groups displayed weak or no correlation with concentrations of chl-a. However, the dominance of filter feeders in the study area may have been favoured by microalgal production in the overlying water (See Table 2). Opposite to patterns observed for terrestrial systems (Scot, 2005), high primary productivity in near shore waters tends to promote low species richness and high evenness (Castro and Huber, 2005). In these areas the role of producer tends to be dominated by a small number of species able to monopolise resources under ambient conditions. Corresponding benthic communities are dominated by the taxa best able to use the associated products or withstand periods of anoxia imposed by excess organic input (Nybakken, 1998).
The extent to which primary production may influence benthic macroinvertebrate abundance and diversity as observed in this present study needs to be further investigated. Emphases should be placed on the determination of those intrinsic properties of habitats which potentially affect the overall impact of primary production on benthic macroinvertebrate abundance and diversity. Investigations on the distribution of populations and assemblages integrated with a hierarchical analysis of spatial variation to fully represent the complexity of natural benthic systems, in order to recognise the potentially important forcing factors is important for ecological understanding of the interplay of factors affecting benthic biocoenosis.
References
Ajao E.A., 1996, Review of the state of pollution of the Lagos lagoon. NIOMR Tech. Paper No. 106. 19pp
Ajao E.A., and Fagade S.O., 1991, Study of the sediments and communities in Lagos Lagoon, Nigeria. Oil and Chemical Pollution. Elsevier Science Publishers Ltd., England. 75-117
American Public Health Association. 1998. Standard Methods for the Examination of Water and Waste Water. 20th Ed. APHA New York. 1270pp
Baillie P.W., and Welsh B.L., 1980, The effect of tidal resuspension on the distribution of intertidal epipellic algae in an estuary. Estuar Coast Shelf Sci. 10:165-180
http://dx.doi.org/10.1016/S0302-3524(80)80056-9
Barnes R.S.K., Calow P., and Olive P.J.W., 1988, The invertebrates: A new synthesis. Blackwell Scientific Publications, Oxford, 582 pp
Brown C.A. 2000. The diversity and density of macrobenthic fauna in the western part of the Lagos lagoon, Lagos, South-west, Nigeria. Ph.D. Thesis, University of Lagos. 346pp
Buffan-Dubau, E. and K.R. Carman. 2000. Diel feeding behaviour of meiofauna and their relationships with microalgal food. Limnol. and Oceanog., 45: 381-395
http://dx.doi.org/10.4319/lo.2000.45.2.0381
Castro, P. and Huber, M. E. 2005. Marine Biology. McGraw Hill Higher Education, New York. 452pp
Cloern J.E. (1987). Turbidity as a control on phytoplankton biomass and productivity in estuaries. Cont Shelf Res. 7:1367-1381
http://dx.doi.org/10.1016/0278-4343(87)90042-2
Cole B. and Cloern J.E. 1987. An empirical model for estimating phytoplankton productivlty in estuaries. Mar Ecol Prog Ser. 36:290-305
http://dx.doi.org/10.3354/meps036299
Colijn, F. and de Jonge, V. 1984. Primary production of microphytobenthos in the Sem- Dollard estuary. Marine Ecol. Prog. Ser., 14: 185-196
http://dx.doi.org/10.3354/meps014185
Cummins K.W. and Merritt R.W. 1996. Ecology and Distribution of Aquatic Insects. In Aquatic Insects of North America. 3rd ed., R.W. Merritt and K.W. Cummins, eds., pp. 74–86. Dubuque, Iowa: Kendall/Hunt Publishing Co.
Daemen E.A. 1986. Comparism of methods for the determination of chlorophyll in estuarine sediments. Neth J Sea Res. 20:21-28
http://dx.doi.org/10.1016/0077-7579(86)90057-8
de Jonge V.N. van Beusekom J.E.E. 1992. Contribution of resuspended microphytobenthos to total phytoplankton in the Ems Estuary and its possible role for grazers. Neth J Sea Res. 30:91-105
http://dx.doi.org/10.1016/0077-7579(92)90049-K
Dudley, T.L., Cooper S.D. and Hemphill N. 1986. Effects of macroalgae on a stream invertebrate community. J. No. Am. Benthol. Soc. 5(2): 93-106
http://dx.doi.org/10.2307/1467864
Edmunds, J. 1978. Sea shells and molluscs found on West African Coasts and Estuaries, Ghana University Press, Accra. 146 pp.
Garrad P. and Hey R.D. 1987. Boat traffic, sediment resuspension and turbidity in a broadland river. J. Hydrology 95:289-297
http://dx.doi.org/10.1016/0022-1694(87)90007-2
Guillard R.R.L., 1975, Culture of phytoplankton for feeding marine invertebrates. In: Smith W.L. and Chanley M.H. [eds) Culture of marine invertebrate animals. Plenum Publishing CO, New York, p 108-132
http://dx.doi.org/10.1007/978-1-4615-8714-9_3
Herman P.M.J., Middelburg J.J., Van de Koppel J. and Heip C.H.R. 1999. Ecology of estuarine macrobenthos. Adv. Ecol. Res. 29: 195-240
http://dx.doi.org/10.1016/S0065-2504(08)60194-4
Holm-Hansen O. 1978. Chlorophyll a determination: improvements In methodology. Oikos 30 438-447
http://dx.doi.org/10.2307/3543338
Jennes M.I. and Duineveld G.C.A. 1985. Effects of tidal currents on chlorophyll a content of sandy sediments in the southern North Sea. Mar Ecol Prog Ser. 21:283-287
http://dx.doi.org/10.3354/meps021283
Kang C.K., Kim J.B., Lee K.S., Kim J.B., Lee P.Y. and Hong J.S. 2003. Trophic importance of benthic microalgae to macrozoobenthos in coastal bay systems in Korea: dual stable C and N isotope analyses. Mar. Ecol. Prog. Ser. 259: 79-92
http://dx.doi.org/10.3354/meps259079
Kendrick G.A., Langtry L.S., Fitzpatrick J., Griffiths R. and Jacoby C.A. 1998. Benthic microalgae and nutrient dynamics in wave-disturbed environments in Marmion Lagoon, Western Australia, compared with less disturbed mesocosms. J. Exp. Mar. Biol. Ecol. 228: 83-105
http://dx.doi.org/10.1016/S0022-0981(98)00011-2
Maasri, A., S. Fayolle, E. Gandouin, R. Garnier, and Franquet. E. 2008. Epilithic chironomid larvae and water enrichment: is larval distribution explained by epilithon quantity or quality? J. No. Am. Benthol. Soc. 27(1): 38-51
http://dx.doi.org/10.1899/07-013R1.1
MacIntyre H.L., Geider R.J. and Miller D.C. 1996. Microphytobenthos: the ecological role of the ‘secret garden’ of unvegetated, shallow-water marine habitats. 1. Distribution, abundance and primary production. Estuaries 19: 186-201
http://dx.doi.org/10.2307/1352224
MacIntyre, H.L. and Cullen, J.J. 1995. Fine scale vertical resolution of chlorophyll and photosynthesis in shallow water benthos. Marine Ecol. Prog. Ser., 12: 227-237
http://dx.doi.org/10.3354/meps122227
Marra J. 1978. Effect of short-term variations in light intensity on photosynthesis of a marine phytoplankter: a laboratory simulation study. Mar Biol 6:191-202
http://dx.doi.org/10.1007/BF00390680
Merritt, R.W., J.R. Wallace, M.J. Higgins, M.K. Alexander, M.B. Berg, W.T. Morgan, K.W. Cummins, and B. Vandeneeden. 1996. Procedures for the functional analysis of invertebrate communities of the Kissimmee River-floodplain complex. Florida Sci. 59(4): 216-74
Middlelburg J.J., Klaver G., Nieuwenhuize J., Wielemaker A., De Haas W., Vlug T. and Van der Nat J.F.W.A. 1996. Organic matter mineralization in intertidal sediments along an estuarine gradient. Mar. Ecol. Prog. Ser. 132: 157-168
http://dx.doi.org/10.3354/meps132157
Murphy, RJ., T.J. Tolhurst, M.G. Chapman and A.J. Underwood. 2008. Spatial variation of chlorophyll on estuarine mudflats determined by field-based remote sensing, Marine Ecol. Prog. Ser., 365: 45-55
http://dx.doi.org/10.3354/meps07456
Nwankwo, D.I. and Akinsoji, A. 1989. The benthic algal community of a sawdust deposition site in Lagos lagoon. Internat. J. Ecol. Env. 15: 197-204
Nybakken, J.W. 1988. Marine Biology. An ecological Approach. Harper and Row Publisher, New York. 514pp
Ogunwenmo, C. A. and Osuala, I. A. 2004. Physico-chemical parameters and macrobenthos of an estuarine creek and an artificial pond in Lagos, southwestern Nigeria. acta SATECH 1(2): 128-132
Pinckney J.L. and Zingmark R.G. 1993. Biomass and production of benthic microalgal communities in estuarine habitats. Estuaries 16: 887-897
http://dx.doi.org/10.2307/1352447
Pinckney J.L., Carman K.R., Lumsden S.E. and Hymel S.N. 2003. Microalgal-meiofaunal trophic relationships in muddy intertidal estuarine sediments. Aquat.Microb.Ecol. 31: 99-108
http://dx.doi.org/10.3354/ame031099
Pinckney, J. and R. Sandulli. 1990. Spatial autocorrelation analysis of meiofaunal and microalgal populations on an intertidal sandflat: scale linkage between consumers and resources, Est. Coast. and Shelf Sci., 30: 341-353
http://dx.doi.org/10.1016/0272-7714(90)90002-9
Pinckney, J., Piceno, Y., Lovell, C.R., 1994. Short-term changes in the vertical distribution of benthic microalgal biomass in intertidal muddy sediments. Diatom Research 9: 143-153
http://dx.doi.org/10.1080/0269249X.1994.9705293
Platt T., Gallegos C.L. and Harrison W.G. 1980. Photoinhibition of photosynthesis in natural assemblages of marine phytoplankton. J Mar Res. 38: 687-701
Schubert, C.J., Niggerman, J., Klockgether, G., and Ferdelman, G., 2005. Chlorin Index: A new parameter for organic matter freshness in sediment. Geochemistry Geophysics and Geosystems, 6(3), 1-12
http://dx.doi.org/10.1029/2004GC000837
Scot, F., 2005, Biological science. Pearson Education, Inc. 1283pp
Shaffer, G.P. and Onuf, C. 1985. Reducing the error in estimating annual production of benthic microflora: hourly to monthly rates, patchiness in space and time. Marine Ecol. Prog. Ser., 26:221-231
http://dx.doi.org/10.3354/meps026221
Statzner B, Dole´ dec S, Hugueny B. 2004. Biological trait composition of European stream invertebrate communities: assessing the effects of various trait filter types. Ecography. 2004. 27: 470-488
http://dx.doi.org/10.1111/j.0906-7590.2004.03836.x
Steigerwalt, N.M. 2005. Environmental Factors Affecting Aquatic Invertebrate Community Structure on Snags in the Ichetucknee River, Florida. (Master’s thesis.) Gainesville: Univ. of Florida
Sullivan M.J. and Moncrieff C.A. 1988. Primary production of edaphic algal communities in a Mississippi salt marsh. J Phycol. 24:49-58
http://dx.doi.org/10.1111/j.1529-8817.1988.tb04455.x
Sun M.Y., Lee C., and Aller R.C., 1994, Spatial and temporal distribution of sedimentary chloropigments as indicators of benthic processes in Long Island Sound. J. of Marine Res., 52: 149-176
http://dx.doi.org/10.1357/0022240943076768
Underwood G.J.C., and Kromkamp J., 1999, Primary production by phytoplankton and microphytobenthos in estuaries. Adv. Ecol. Res. 29: 93-153
http://dx.doi.org/10.1016/S0065-2504(08)60192-0
Webb, J.E., 1958, The Ecology of Lagos lagoon. I: The lagoons of the Guinea Coast Philosophical Transaction Royal Society London. Ser. B. 241-283


. PDF(700KB)
. FPDF(win)
. HTML
. Online fPDF
Associated material
. Readers' comments
Other articles by authors
. R.E. Uwadiae
. A.A. Ajose
Related articles
. Chl-a
. Benthic macroinvertebrate
. Abundance and diversity
. Estuarine ecosystem
Tools
. Email to a friend
. Post a comment