1. Centre of Advanced Study in Marine Biology, Faculty of Marine Sciences, Annamalai University, Parangipettai-608 502, India
2. National Botanical Research Institute, Rana Pratap Marg, Lucknow-226 001, India
3. Rajiv Gandhi Centre for Aquaculture, Chirala Mandal, Andra Pradesh-523 157, India

Author

Correspondence author
International Journal of Marine Science, 2015, Vol. 5, No. 25 doi: 10.5376/ijms.2015.05.0025
Received: 21 Dec., 2014 Accepted: 27 Mar., 2015 Published: 20 Apr., 2015
A bio-monitoring study was performed to investigate certain metals (cadmium, cobalt, copper, iron, magnesium, manganese, nickel, lead, zinc, aluminium and boron), using Inductively Coupled Plasma Optical Emission Spectrometer (ICP-OES) for the assessment of the present status in the two coastal ecosystems and compiling the baseline data for future monitoring. Tissue samples of fishes have different level of accumulation viz, Cd = 0.07-0.40, Co = 0-0.32, Cu = 0.53–0.39, Fe = 1.42–8.12, Mg = 9.74–33.1, Mn = 0.08–0.84, Ni = 0.01–0.97, Pb = 0.12–2.05, Zn = 0.81–2.11, Al = 1.26-3.98, Cr = 0.25-1.76 and B = 0.17-1.87 µg g -1 dry wt. respectively. The rate of metal accumulation higher in species (Thalassoma trilobatum and Saurida tumbil). Concentration of toxic metals such as Cd and Pb were well above the permissible limits proposed by the World Health Organization and Food and Agricultural Organizations.
Trash fish; Low value food fish; Metal accumulation; ICP-OES; Cuddalore; Pazhayar
Marine organisms, in general, accumulate contaminants from the environment and therefore have been extensively used in marine pollution monitoring programmes (UNEP, 1993; Uthe et al., 1991). In many countries, significant alterations in industrial development lead to an increased discharge of chemical effluents into the ecosystem, leading to damage of marine habitats. Metal contamination has been identified as a concern in coastal environment, due to discharges from industrial wastes, agricultural and urban sewage. Metals, normally occurring in nature, are not harmful to the environment, because they play an essential role in tissue metabolism and growth of plants and animals (Amundsen et al., 1997). Bioavailability of dietary metals is still not considered in regulatory guidelines (US Environmental Protection Agency, 1992), but dietary exposure may be a major uptake route for many potentially toxic metals in the marine fish.
Metals such as iron, copper, zinc, magnesium and manganese, are essential metals, since they play an important role in biological systems, whereas nonessential metals, such as Cd, Co Ni and Pb, and are toxic even in trace levels. The essential metals can also produce toxic effects at higher concentrations. Only a few metals of proven hazardous nature are to be completely excluded in food for human consumption. Thus, only three metals, namely lead cadmium and mercury, have been included in the regulations of the European Union for hazardous metals (EEC, 2001), while the USFDA (United States of Food and Drug Administration) has included further three elements, namely, chromium, arsenic and nickel in the list (Sivaperumal et al., 2007). Metal discharged into the marine environment can damage both species diversity and ecosystems, due to their toxicity and accumulative behaviour (Matta et al., 1999).
Among the food products available, fish is currently considered as one of the most important foods (Carvalho et al., 2005). Fishes are at the top of the aquatic food chain and may accumulate large amounts of metals from water, food or sediments. In the field and laboratory studies showed that accumulation of heavy metals in the tissue depends mainly on metal concentrations in water, as well as exposure period. Metals, including both essential and nonessential elements have a particular significance in ecotoxicology, since they are highly persistent and all have the potential to be toxic to living organisms (Ebrahimpour & Mushrifah, 2009).
The consequence of heavy metal pollution can be hazardous to man and it often becomes mandatory to check chemical contaminants in foods from the aquatic environment to understand their hazard levels. These studies are largely based on accumulation of higher levels of heavy metals in different tissues such as liver, gills and muscle. Gill has a tendency to accumulate metals to higher degree than muscle tissue, which usually exhibits a low accumulation potential of metals. Muscle was chosen in the present study for determining the metal concentration because it is the part consumed because of its direct contact with the surrounding water. Although fish skin is also consumed, only little research has been carried out on the residues of metals in fish skin (Storelli et al., 2006).
In the present study, the food fishes analysed are having low economic importance. Even though, there is much more industrial activity in Cuddalore than Pazhayar, both areas were selected to compare and determine the levels of trace metals viz. cadmium (Cd), cobalt (Co), copper (Cu), iron (Fe), magnesium (Mg), manganese (Mn), nickel (Ni), lead (Pb), zinc (Zn), aluminum (Al), chromium (Cr) and boron (B) in the body organs of seven fin fishes from each station, in order to evaluate their hazard level in relation to the maximum residual limit for human consumption.
Materials and Methods
Study area
Cuddalore landing center
Cuddalore fish landing center (lat. 11°76’N; long. 79°74’E) is one of the major fish landing center in Tamilnadu southeast coast of India that hosts a number of large-scale industries (Figure 1). The Uppanar river runs parallel to the southeast coast of Cuddalore and a number of small streams of domestic, treated and untreated effluents from industries connected the coast via the river.
.png)
Figure 1 Map showing the sampling locations at Cuddalore and Pazhayar, Bay of Bengal, India
|
Pazhayar landing center
Pazhayar is situated near the Coleroon debouches into the Bay of Bengal (Lat. 11°36’N; Long. 79°79’E) on the Southeast coast of India. There are mechanized trawlers are operating from this landing center, non – mechanized boats and Catamarans also engaged in fishing activities.
Sample collection
Seven different trash fish species were collected between January, 2011 – March, 2011 from the both landing centers. Fishes were identified using FAO sheet and field guides and total lengths were measured viz, Thalassoma trilobatum, Parapercis heropthalma, Saurida tumbil, Pseudorhompus javanicus, Apogon quadrifasciatus, Priacanthus humrur and Stomia spp. For each species, five representative sample groups with similar lengths were taken for the confirmation study.
Determination of metal concentration
The collected fish species were immediately brought to the laboratory in an ice box and the gills and muscle of each fish. Muscle and gills were cut into small pieces and dried at 70 0C for 15 min. in Microwave oven (Technico, India). After complete drying, samples were fine powdered using mortar and pestle and weighed to 1 g (± 0.01 g) and samples were digested in 100 ml glass beaker with concentrated nitric acid (20 ml) overnight. It was then mixed with 10 ml of concentrated nitric and perchloric acid solution (4:1) followed by hotplate heating at 120 0C up to complete dryness. The residue was then dissolved and diluted with 20 ml of a solution of deionised water and concentrated nitric acid (4:1) (v:v) and then this solution is filtered through Whatman filter paper (11 µm) and metal accumulation levels were determined by using Inductively Coupled Plasma Optical Emission Spectrometer (Software – WinLab 32) (Perkin Elmer, Optima 2100DV). The precision of the analytical procedure was checked by analysing standard reference materials of commercially available standards (Merck KGCA, 64271 Damstadt, Germany, ICP-Multi element standard solution IV, 23 elements in nitric acid). All acids and chemicals were of analytical reagent grade. Metal concentrations were calculated in microgrammes per gramme dry weight (µg metal g-1 d.w.). Two replicate analyses were made in order to have good accuracy. All the glasswares were kept overnight in 10 % nitric acid solution and rinsed with deionised water and air dried before use.
Statistical analysis
Pearson Correlation Coefficient was employed for the better understanding of relationship between the concentrations of various metals with various tissue types using statistical package of SPSS 16.0 for windows. One way ANOVA was employed to understand the variation in the concentration of heavy metals with respect to different species and organs.
Results and Discussion
Fish are at the top of the aquatic food chain and normal metabolism of fish may accumulate large amounts of certain metals from water, food or sediment. However, like essential metals, nonessential metals are also taken up by fish and accumulate in their tissues (Yilmaz, et al., 2010). Few reports described metal residues in wild marine fish species (Cogun et al., 2006; Storelli et al., 2006).
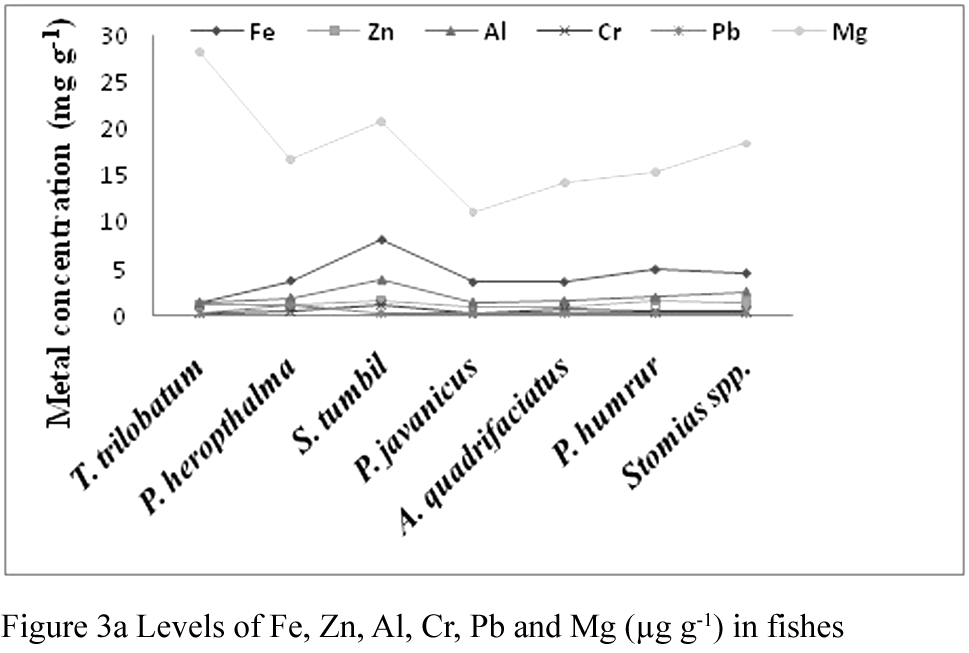
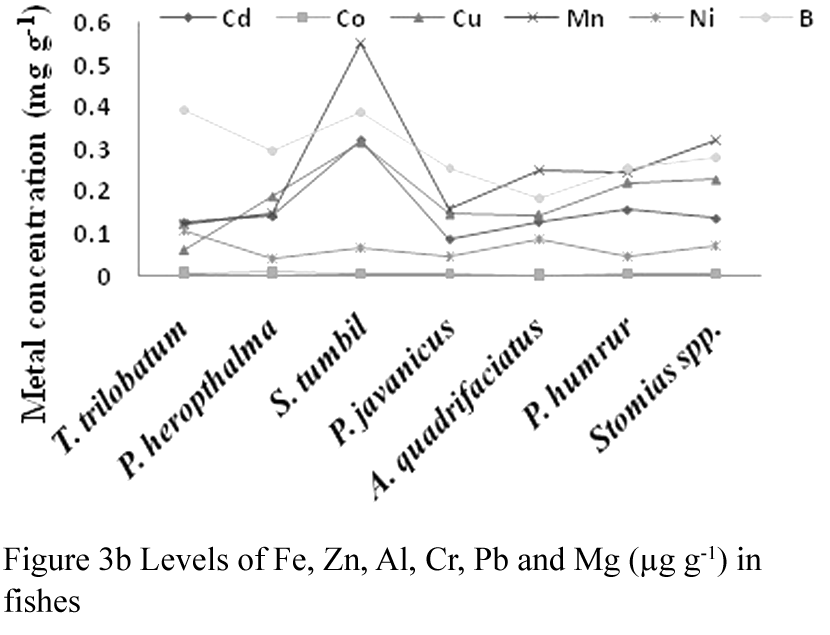
In the present study, Cd, Co, Cu, Fe, Mg, Mn, Ni, Pb, Zn, Al, Cr and B concentrations (µg g -1 dry wt) were determined in the trash fishes (gill and muscle tissues). The distribution of heavy metal concentrations in tissue samples, collected from different species of the Cuddalore and Pazhayar coast are given in Figure 2 a-b and 3 a-b. Metals were found with significant variations in their concentrations with respect to fish species. The Pazhayar fish samples showed lower concentrations for majority of metals than Cuddalore trash fish samples. Concentration of Co was found below detectable level (BDL) in three out of seven tested fishes in each station. In the present study twelve metals were studied, concentrations of all trace metals are given in Table 1-2. Distribution graph of the heavy metals clearly indicated the variation in the concentrations of different metals (Figure2 a-b and 3 a-b). Concentration of each metal varied significantly in each species (one way ANOVA P< 0.05).
.png)
Figure 2a Levels of Fe, Mg, Pb, Zn, Al and Cr (µg g-1) in fishes
|
.png)
Figure 2b Levels of Cd, Co, Cu, Mn, Ni and B (µg g-1) in fishes
|
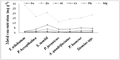
Figure 3a Levels of Fe, Zn, Al, Cr, Pb and Mg (µg g-1) in fishes
|
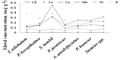
Figure 3b Levels of Fe, Zn, Al, Cr, Pb and Mg (µg g-1) in fishes
|
.png)
Table 1 Concentration of heavy metals accumulation (µg g -1 dry wt.) in fishes collected from Cuddalore (polluted area)
|
.png)
Table 2 Concentration of heavy metals accumulation (µg g -1 dry wt.) in fishes collected from Pazhayar (unpolluted area)
|
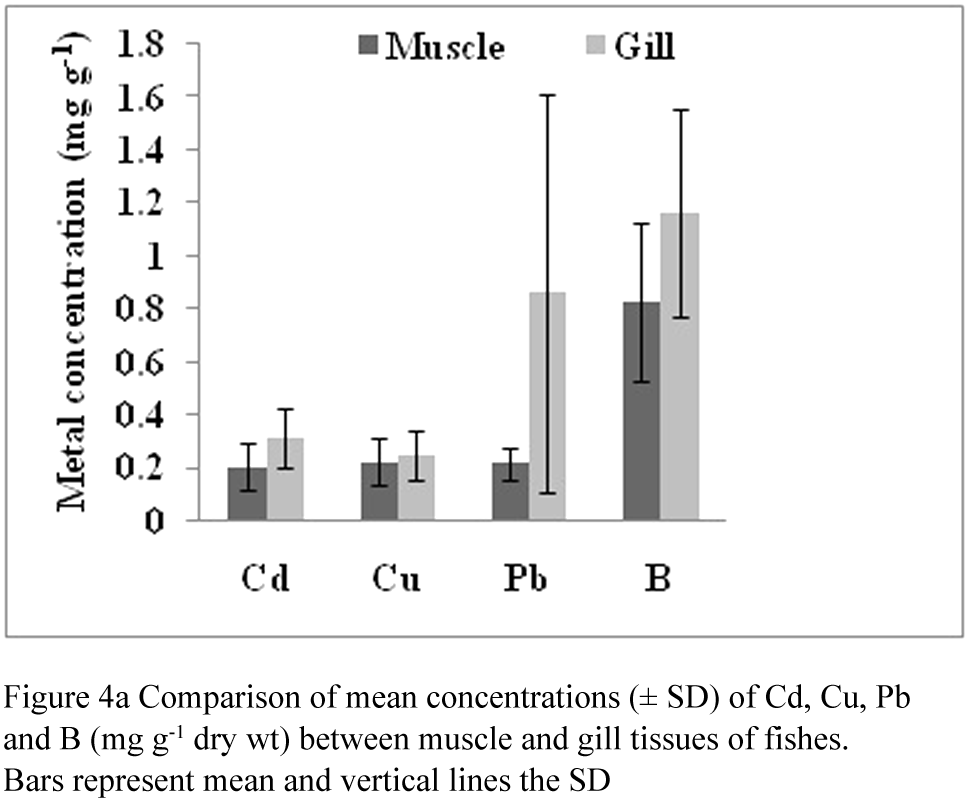
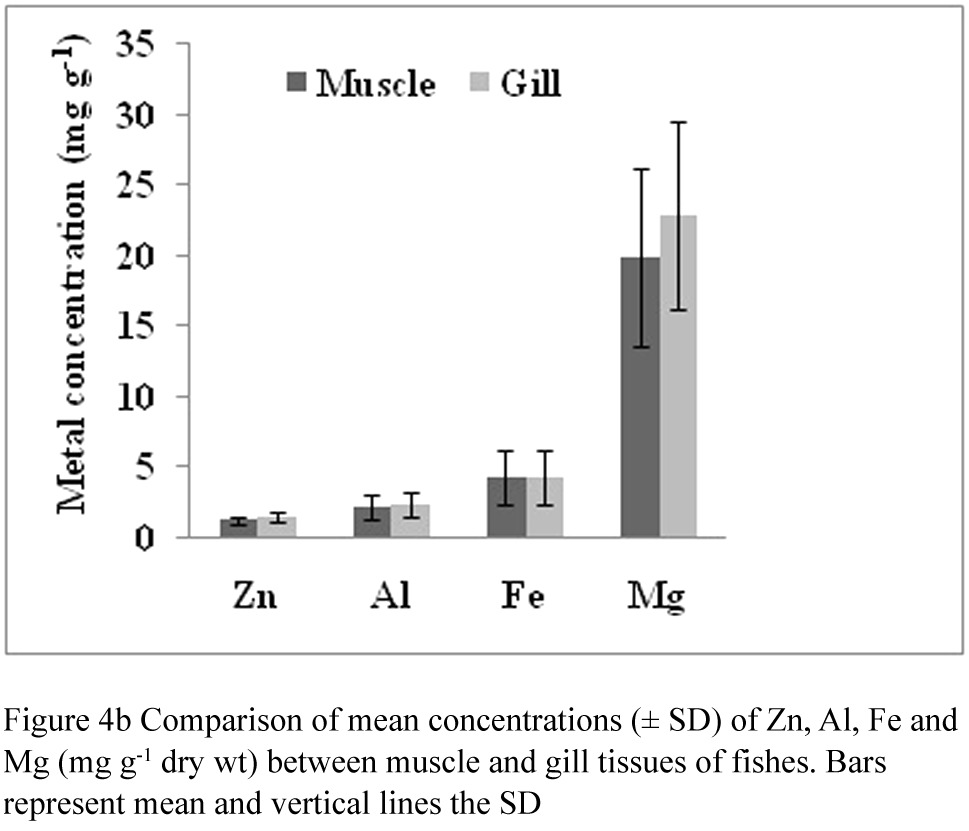
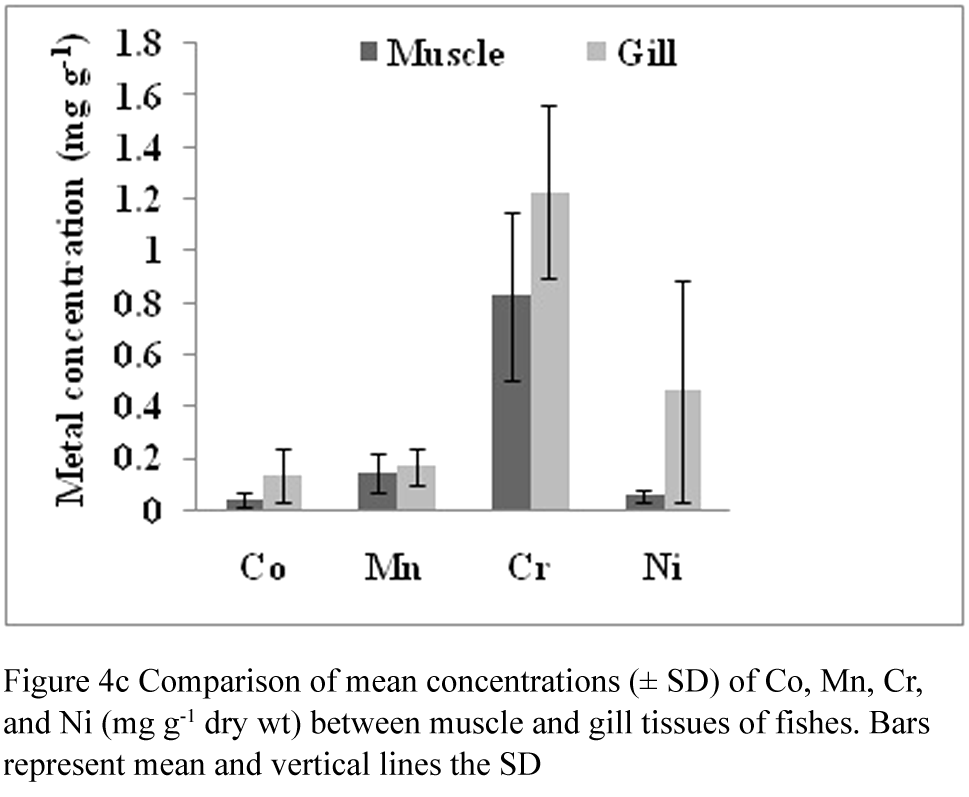
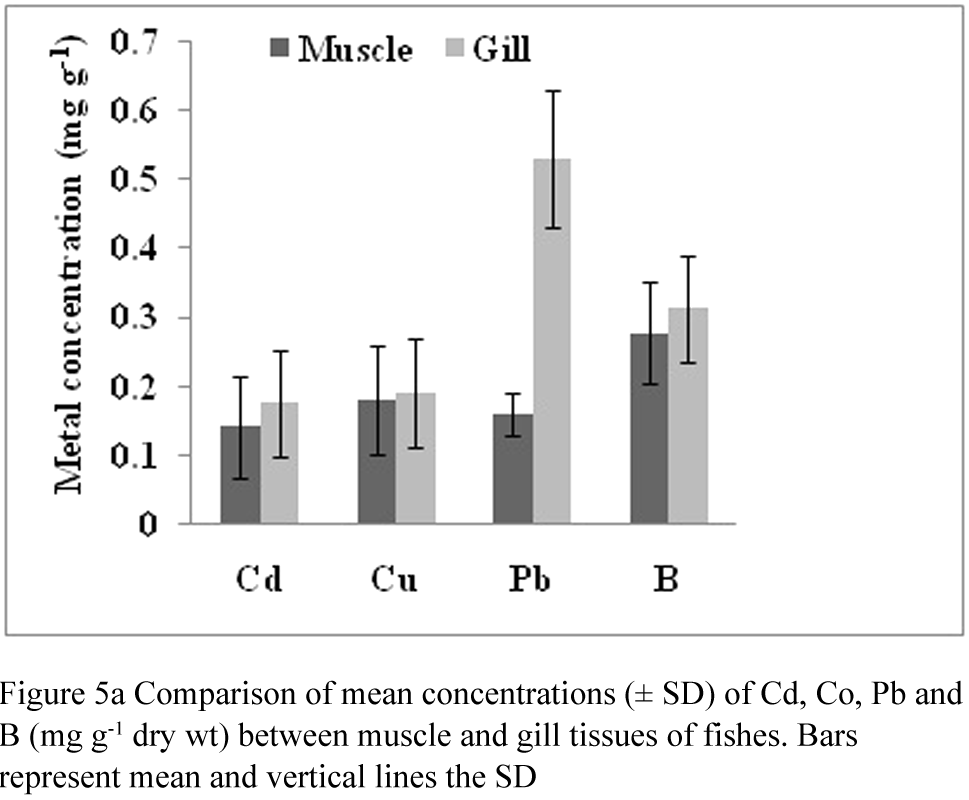
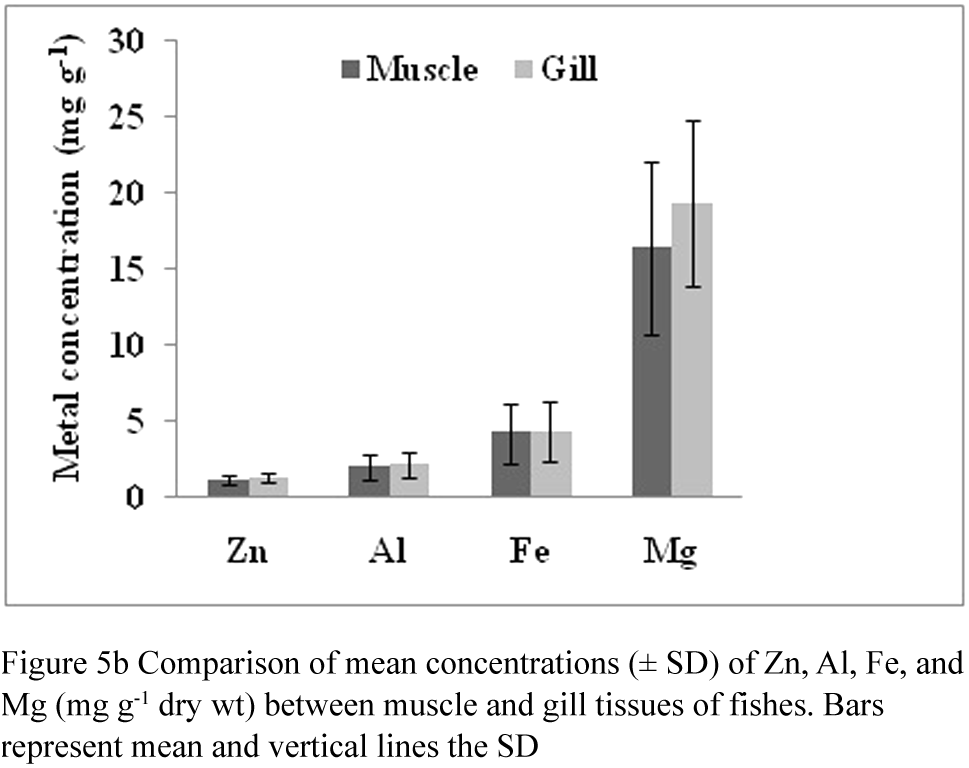
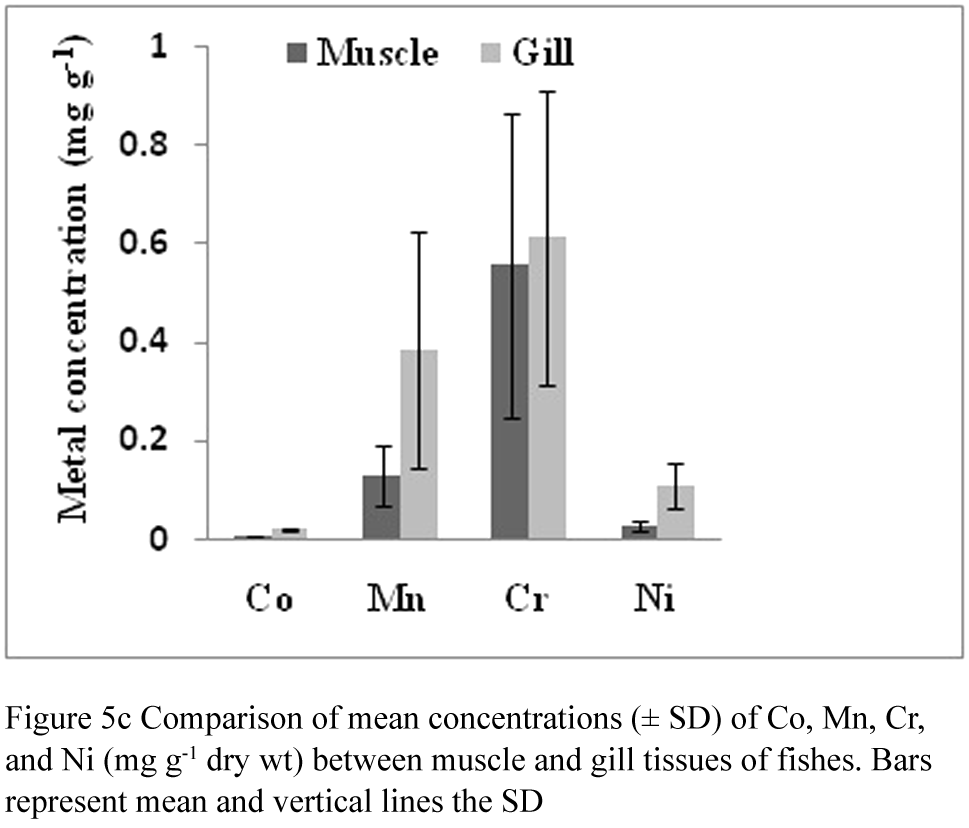
Metal concentrations and the corresponding mean standard deviations (µg g -1 dry wt) were measured in gill and muscle tissues for all trash fishes of both landing centre (Figure 4a-c and 5a-c).All the metals were found highly accumulated in gills than the muscle. Mean trace metal levels of different fishes were given in Table 3-4. Average cadmium, cobalt, copper, iron, magnesium, manganese, nickel, lead, zinc, aluminum, chromium and boron concentrations were found to be viz, 0.07-0.40, 0-0.32, 0.06–0.37, 1.42–8.12, 9.74–33.1, 0.08–0.84, 0.01–0.97, 0.12–2.05, 0.81–2.11, 1.26-3.98, 0.25-1.76 and 0.17-1.87 µg g -1 dry wt. respectively.
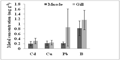
Figure 4a Comparison of mean concentrations (± SD) of Cd, Cu, Pb and B (mg g-1 dry wt) between muscle and gill tissues of fishes. Bars represent mean and vertical lines the SD
|
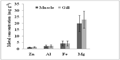
Figure 4b Comparison of mean concentrations (± SD) of Zn, Al, Fe and Mg (mg g-1 dry wt) between muscle and gill tissues of fishes. Bars represent mean and vertical lines the SD
|
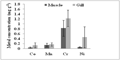
Figure 4c Comparison of mean concentrations (± SD) of Co, Mn, Cr, and Ni (mg g-1 dry wt) between muscle and gill tissues of fishes. Bars represent mean and vertical lines the SD
|
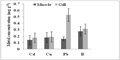
Figure 5a Comparison of mean concentrations (± SD) of Cd, Co, Pb and B (mg g-1 dry wt) between muscle and gill tissues of fishes. Bars represent mean and vertical lines the SD
|
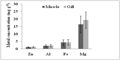
Figure 5b Comparison of mean concentrations (± SD) of Zn, Al, Fe, and Mg (mg g-1 dry wt) between muscle and gill tissues of fishes. Bars represent mean and vertical lines the SD
|
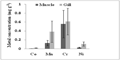
Figure 5c Comparison of mean concentrations (± SD) of Co, Mn, Cr, and Ni (mg g-1 dry wt) between muscle and gill tissues of fishes. Bars represent mean and vertical lines the SD
|
.png)
Table 3 Order of mean metal concentration in the low value trash fishes of Cuddalore (polluted area)
|
.png)
Table 4 Order of mean metal concentration in the low value trash fishes of Pazhayar (unpolluted area)
|
Cadmium is a serious contaminant, a highly toxic element,which is transported to sea through air. The limit of Cd for humanconsumption of fish is approximately 0.5 µgg -1 dry wt. (CSHPF,1995). Mean concentrations of cadmium were ranged from 0.07-0.40 µg g -1 and it showed highest level in gill than the muscle tissues but higher than maximum permissible limits recommended by FAO/WHO, (1976). These values are higher than the earlier reports (Ashraf et al., 1991: Tariq et al., 1994 and Vijayakumar et al., 2011) but lower than the permissible limits. Mendil et al. (2010) have reported 0.11 to 0.75 µg g -1cadmium in fish species from Yesilirmak river and it is coincide with the present study.
Concentrations of Cu in the fish samples were between 0.06 and 0.37 µg g -1 and it is lower than the permissible limit. The maximum level of copper was observed in gill of Saurida tumbil and minimum in Thalassoma trilobatum muscle. Mendil et al. (2010) and Dhaneesh et al. (2012) reported the values for Cu were 1.0-2.5 µg g -1 and 0.98±0.22 µg g -1 respectively and the present results were lower than these values and similar to Vijayakumar et al. (2011) (0.42-0.61 µg g -1). As copper is an essential part of several enzymes and necessary for synthesis of heamoglobin, most marine organisms have evolved mechanisms to regulate the concentrations of this metal in their tissues. According to Turkish Food Codex the maximum copper level permitted for fishes is 20 mg/kg (Ananymous, 2002).
The concentration of cobalt was found to be 0-0.32 µg g -1 and it is high in gill tissues and below detectable level (BDL) in the muscle. Turkmen et al. (2008) have investigated Co levels in fish samples and they found higher concentration (0.04-0.41 mg kg-1) than the present study. Turkmen et al. (2005) reported that cobalt concentration varied between 0.73 and 1.91 mg/kg -1 in the muscles of fishes of the Iskenderun Bay and lower Co levels in fish muscles (<0.001-0.002mg/kg -1) have been reported from the Mediterranean Sea region. These levels are in good agreement with our values. Cobalt is an essential nutrient for man and is an integral part of vitaminB12. Underwood (1977) reported that the average daily intake of cobalt, in all forms, ranges 0.30-1.77mg/day. Cobalt has also been implicated in blood pressure regulation and has been found to be necessary for proper thyroid function Blakhima (1970).
Iron concentration levels of muscle and gills were found to be 1.42 and 8.12 µg g -1 in Thalassoma trilobatum and Saurida tumbil. Uluozlu et al. (2007) have been reported the iron values as 68.6-163 µg g -1 and these values are higher than the present study and lower value are reported by Tariq et al. (1994) and Asharaf et al. (1991) as 0.782-4.217 and 1.550-6.715 µg g -1 respectively. Iron is a mineral essential for the life and for our diets. It is known that adequate iron in a diet is very important for decreasing the incidence of anemia. Iron deficiency occurs when the demand for iron is high, e.g., for growth, high menstrual loss and pregnancy (Lynch and Baynes, 1996). Poor bioavailability is considered to be an important factor leading to iron deficiency in many countries.
Magnesium showed highest concentration in gill tissues than the muscle (33.1-9.74 µg g -1) and these values are lower than the values reported by Dhaneesh et al. (2012) (99.84-79.99 µg g -1). According to NAS-NRC (1974), total daily intake of Mg varies from 2.5 to 7 mg in humans.
Average manganese contents of the fish samples were varied from 0.08-0.84 µg g -1 in gill and muscle and these values are lower than the previous reports (Uluozlu et al., 2007; Biswas et al. 2011). Manganese is an essential element for both animals and plants and its deficiency results in severe skeletal and reproductive abnormalities in mammals (Sivaperumal et al., 2007). However, manganese has human requirements or levels of absorption from the diet been clearly determined (Hurley, 1984; Tinggi, 1997).
In the present study, concentration of nickel was varied from 0.01to 0.97 µg g -1 and these values were higher than the previous reports (Topcuoglu et al., 2011; Mendil et al., 2010). Nickel is a hazardous element notified by the USFDA (1993), though not covered by EC regulations for fish and other aquaticproducts. WHO (World Health Organization, 1994) recommends 100-300 µg nickel for daily intake.
Lead concentrations were ranged from 0.12 to 2.05 µg g -1 and these were lower than the value reported by Chale (2002) (4.9-5.30 µg g -1) and Park and Presley (1997) (1.95 to 4.79 µg g-1). For an average adult (60 kg body weight), the provisional tolerable daily intake (PTDI) for iron, copper and zinc were 241 µg, 48 mg and 60 mg, respectively (Joint FAO/WHO, 1999). According to WHO (1989), the maximum permissible limit of lead was 0.2 mg/kg. In the present study, the lead values in Cuddalore were higher than the permissible limits.
Zinc concentration was ranged from 0.81 to 2.11 µg g -1 and these values were lower than the previous reports (Turkmen et al., 2009; Biswas et al., 2011). Zinc, is an essential micronutrient and as a constituent of many enzymes, it is responsible for certain biological functions, for which relatively higher level is required to maintain them (Heath, 2000). The recommended daily allowance is 10 mg/day in growing children and 15 mg/day for adults (NAS-NRC, 1974). A deficiency of zinc is marked by retarded growth, loss of taste and hypogonadism, leading to decreased fertility. Zinc toxicity is rare but, concentrations in water, up to 40 mg/kg, may induce toxicity, characterised by symptoms of irritability, muscular stiffness and pain, loss of appetite and nausea (NAS-NRC, 1974).
Aluminium concentration ranged from 1.26 to 3.98 µg g-1 and these values are higher than the earlier reported values of 0.45-1.50 µg g -1 dry weight in fish species from Iskenderun bay, north-east Mediterranean Sea, Turkey (Turkman et al., 2005). Ranau et al. (2001) have reported aluminium levels in the fish samples and they found higher aluminium accumulation in species as 0.02-5.41 µg g-1. Aluminum is not considered to be an essential element in humans. Exposure to aluminium has been implicated in a number of human pathologies including encephalopathy/dialysis dementia, Parkinson disease and Alzheimer’s disease (Narin et al., 2004). The permissible aluminium dose for an adult is quite high (60 mg/day) (World Health Organization, 1989). It is reported that maximum aluminium levels in some food samples are 15 mg/kg (Anon., 2002).
Cr is an essential mineral for humans and has been related to carbohydrate, lipid, and protein metabolism. The maximum permitted level of Cr for human consumption is 50 μgg−1 as per WHO (1989). In the present study, concentration of chromium was varied from 0.25 to 1.76 µg g -1. Canli and Atli (2003) have reported higher values (1.24-2.42 µg g -1) and Kwon and Lee (2001) have reported lower chromium concentration than the present study. Average boron contents of fish samples were ranged from 0.17-1.87 µg g-1. Yilmaz et al. (2010) have investigated the accumulation of boron in the fishes and they found below the limits of detection in all the tissues samples.
This indicated that the distribution of Cd, Ni, Mn, Al, Pb and Cr in analysed samples were very low rather than Fe, Co, Cu, Mg, Zn, and B. The relationship between metals in trash fishes from Cuddalore [Cd (R2 = 0.515), Co (R2 = 0.008), Cu (R2 = 0.998), Fe (R2 = 0.999), Mg (R2 = 0.990), Mn (R2 = 0.980), Ni (R2 = 0.088), Pb (R2 = 0.752), Zn (R2 = 0.171), Al (R2 = 0.634), Cr (R2 = 0.199) and B (R2 = 0.588] and Pazhayar [Cd (R2 = 0.928), Co (R2 = 0.372), Cu (R2 = 0.998), Fe (R2 = 0.996), Mg (R2 = 0.993), Mn (R2 = 0.773), Ni (R2 = 0.178), Pb (R2 = 0.821), Zn (R2 = 0.951), Al (R2 = 0.996), Cr (R2 = 0.996) and B (R2 = 0.915] were evaluated by the regression method.
Results obtained from the present study reveal thatthe concentrations of Ni, Co, Cr and Al are below well the permissible limits and suggesting that these metals are at safer level. The concentration of Cd and Pb was above the permissible level in Cuddalore and it might be due the presence of large scale industries which can significantly contribute to the heavy metal load in to the estuarine system.
Conclusion
The present study was carried out in polluted and unpolluted areas to find out the status of heavy metal concentrations in different trash fish species, landed in Cuddalore and Pazhayar landings. As expected, significant differences were found in different tissues in the accumulation levels of the selected metals. This result showed that higher levels of metals were found in the gill, while lower levels were obtained in the muscle. The concentration of trace metals in samples is depended on fish species and habitat.
It may be concluded that consumption of these species from this region is not a problem for human health, but Cd and Pb is higher than the maximum permissible levels in Cuddalore. However, a potential risk may emerge in the future, depending on the increasing chemicals, beverage manufacturing, domestic waste water disposal, oil, soap, paint production, paper and metal processing plants, ship and boat transports. It is anticipated that, in future, Cuddalore may receive a huge amount of heavy metals due to the increasing industrial activities in this region than the Pazhayar. Further, the present values of metals concentrations can be used as a baseline data for future comparisons with regard to heavy metal pollution in trash fishes.
Acknowledgements
The authors are grateful to Prof. K. Kathiresan, Dean and Director, CAS in Marine Biology, Faculty of Marine Sciences, Annamalai University, Parangipettai for providing facilities to carry out this research work and the Department of Biotechnology (DBT/PR-9230/BLE/08/557/2007), Govt. of India for their financial assistance.
Amundsen, P. F. Staldvik J. Lukin A. A. Kashulin N. A. Popova O. A. and Reshetnikov Y. S. 1997. Heavy metal contamination in freshwater fish from the border region between Norway and Russia. Scien. Tot. Environ, 201, 371-378
http://dx.doi.org/10.1016/S0048-9697(97)84058-2
Anonymous, 2002. Regulation of setting maximum levels for certain contaminants in foodstuffs. Official Gazette, October 16, Iss: 24908
Biswas, S. Krishna R. Prabhu Jahir Hussain, K.M. Selvanayagam, K.K. Satpathy. 2011. Heavy metals concentration in edible fishes from coastal region of Kalpakkam, southeastern part of India.Environ. Monit. Assess. DOI 10.1007/s10661-011-23-25y (2011)
Blakhima, R. J. 1970. Trace element metabolism in animals. In C. F. Mills (Ed.). Livingstone: Edinburgh
Cogun, H. Y. Yuzereroglu T. Firat O. Gok G. and Kargin F. 2006. Metal concentrations in fish species from the northeast Mediterranean Sea. Environ. Monit. Assess, 121, 431-438
http://dx.doi.org/10.1007/s10661-005-9142-0
CSHPF, 1995. Conseil Superieur d’Hygiene Publique de France. Plomb, cadmium et mercure dans l’alimentation:´Evaluation et gestion du risque. Minist‘ere du Travail et des Affaires Sociales,´editeur. Paris: Lavoisier Tec. Doc
Dhaneesh, K. V. Gopi M. Ganeshamurthy R. Ajith Kumar T. T. and Balasubramanian. T. 2012. Bio-accumulation of metals on reef associated organisms of Lakshadweep Archipelago. Food Chem., 131, 985-991
http://dx.doi.org/10.1016/j.foodchem.2011.09.097
Ebrahimpour, M. and Mushrifah I. 2009. Variation and correlations of selected heavy metals in sediment and aquatic plants in Tasik Chini, Malaysia. Environ. Geol, 57, 823-831
http://dx.doi.org/10.1007/s00254-008-1362-5
EEC, 2001. Commission Regulation (EC) No 466/2001of 8 March 2001 setting maximum levels for certain contaminants in foodstuffs. Official J. Europ. Comm, L77
FAO/WHO, 1976. List of maximum levels recommended for contaminants by the Joint FAO/WHO Codex Alimentarius Commission. Second Series. CAC/ FAL, Rome, 3, 1-8
Heath, A. G. 2000. Water pollution and fish physiology (second ed.). NW, Boca Raton, Florida, USA: CRC Press
Hurley, L. S. 1984. Nutritional aspects of manganese. In: Bratter, P., Schramel, P., de Gruyter, W. (Eds.), Trace Elements Analytical Chemistry in Medicine and Biology. Springer Verlog, Berlin, pp. 239-251
Joint FAO/WHO, 1999. Expert Committee on Food Additives. Summery and Conclusions, 53rd Meeting, Rome, 1-10 June
Lynch, S. R. and Baynes R. D. 1996. Deliberations and evaluations of the approaches, endpoints and paradigms for iron dietary recommendations. American Institute of Nutrition, 2404S, 2409S
Matta, J. Milad M. Manger, R. and Tosteson. T. 1999. Heavy metals, lipid peroxidation, and cigateratoxicity in the liver of the Caribben barracuda (Sphyraena barracuda). Biol. Trac. Elem. Res, 70, 69-79
http://dx.doi.org/10.1007/BF02783850
Mendil, D. Faruk Unal O. Tuzen M. and Soylak M. 2010. Determination of trace metals in different fish species and sediments from the river Yesilırmak in Tokat, Turkey. Food. Chem. Toxicol, 48, 1383-1392
http://dx.doi.org/10.1016/j.fct.2010.03.006
Narin, I. Tuzen M. and Soylak M. 2004. Aluminium determination in environmental samples by graphite furnace atomic absorption spectrometry after solid phase extraction on amberlite xad-1180/pyrocatechol violet chelating resin. Talan, 63, 411-418
http://dx.doi.org/10.1016/j.talanta.2003.11.005
NAS-NRC, 1974. National Academy of Sciences-National Research Council. Food and Nutrition Board. Recommended dietary allowances. Washington DC: National Academic Press
Sivaperumal, P. Sankar T. V. and Nair. P. G. V. 2007. Heavy metal concentrations in fish, shellfish and fish products from internal markets of India vis-à-vis international standards. Food Chem, 102, 612-620
http://dx.doi.org/10.1016/j.foodchem.2006.05.041
Storelli, M. M. Barone G. Storelli A. and Marcotrigiano G. O. 2006. Trace metals in tissues of Mugilids (Mugil auratus, Mugil capito and Mugil labrosus) from the Mediterranean Sea. Bull. Environ. Cont. Toxicol, 77, 43-50
http://dx.doi.org/10.1007/s00128-006-1030-y
Topcuoglu, S. Kirbasoglu C. and Gungor N. 2011. Heavy metals in organisms and sediments from Turkish Coast of the Black Sea. Environ. Int, 1069, 1-8
Turkmen, A. Turkmen M. Tepe Y. and Akyurt I. 2005. Heavy metals in three commercially valuable fish species from Iskenderun Bay, Northern East Mediterranean Sea, Turkey. Food Chem, 91, 167-172
http://dx.doi.org/10.1016/j.foodchem.2004.08.008
Turkmen, M. Turkmen A. Tepe Y. Ates A. and Gokkus. K. 2008. Determination of metal contaminations in sea foods from Marmara, Aegean and Mediterranean seas: Twelve fish species. Food Chem, 108, 794-800
http://dx.doi.org/10.1016/j.foodchem.2007.11.025
Uluozlu, O. D. Tuzen M. and Soylak M. 2009. Speciation and separation of Cr (VI) and Cr (III) using co precipitation with Ni2+/2-nitroso-1-naphthol-4-sulfonic acid and determination by FAAS in water and food samples. Food Chem. Toxicol, 47, 2601-2605
http://dx.doi.org/10.1016/j.fct.2009.07.020
Underwood, E. J. 1977. Trace Elements in Human and Animal Nutrition (forth eds.). New York: Academic
UNEP, 1993. Guidelines for monitoring chemical contaminants in the sea using marine organisms, Reference methods for marine pollution studies, (1993)
US, 1992. Environmental Production Agency. Interim guidance on interpretation and implementation of aquatic life criteria for metals DC, Washington: US EPA
USFDA, 1993. Food and Drug Administration. Washington, DC: Guidance Document for Chromium in Shellfish. DHHS/PHS/FDA/CFSAN/Office of Seafood
Uthe, J. F. Chou C.L. Misra R. K. Yeats P. A. Loring D. H. and Musial C. J. 1991. Temporal trend monitoring: introduction to the study of contaminant levels in marine biota. ICES Tech. Mar. Environ. Sci. Report 14, Copenhagen
Vijayakumar, P. Lavanya R. Veerappan, N. Balasubramanian. T. 2011. Heavy Metal Concentrations in Three Commercial Fish Species in Cuddalore Coast, Tamil Nadu, India. J. Exp. Sci, 2(8), 20-23
WHO, 1994. Quality directive of potable water, second ed., 197
WHO, 1989. Environment Health Criteria. Heavy metals-environmental aspects, Geneva, Switzerland
Yılmaz, A. B. M. Sangun K. Yaglıoglu D. and Turan. C. 2010. Metals (major, essential to non essential) composition of the different tissues of three demersal fish species from Iskenderun Bay, Turkey. Food Chem., 123 (2010) 410-415
http://dx.doi.org/10.1016/j.foodchem.2010.04.057

.png)
.png)
.png)