Interrelationship Between Planktonic Diatoms and Selected Governing Physicochemical Parameters of the Hooghly Estuary, Bay of Bengal 
2. Manicktala Siksha Bhavan, 304/B/1 Bagmari Road, Kolkata-700054, India
3. Department of Botany, Burdwan University, Rajbati, Burdwan – 713104, India
 Author
  Correspondence author
International Journal of Marine Science, 2015, Vol. 5, No. 47 doi: 10.5376/ijms.2015.05.0047
Received: 05 May, 2015 Accepted: 15 Jun., 2015 Published: 13 Aug., 2015
De T. K., Mukherjee A., Das S., Chakraborty S., De M. and Maiti T.K., 2015, Interrelationship Between Planktonic Diatoms and Selected Governing Physicochemical Parameters of the Hooghly Estuary, Bay of Bengal, International Journal of Marine Science, 5(47): 1-9 (doi: 10.5376/ijms.2015.05.0047)
The estuarine ecosystem is generally dynamic and mostly sets the stage for the interplay between phytoplankton such as diatom and the water quality parameters. The study was performed at selected sites of Hooghly estuary to monitor the effect of chosen physicochemical parameters (pH, salinity, dissolved oxygen, nutrients etc.) in relation to seasonal fluctuations in the diatom communities (Chl a and population density). The study encompassed a period of two years (Nov’12 to Oct’14). Seasonal variations in the Redfield ratio (N: P) during the tenure of the study ranged from 5.52 during premonsoon to 14.43 during monsoon. Low salinity and high inorganic compounds (NO3, PO4 and SiO4) levels in the coastal water could have contributed to the predominance of diatoms over dinoflagellates, as observed during the study. The study also reflected the fact that in the mangrove dominated estuarine ecosystems, diatom species like Skeletonema sp., Thalassionema spp., Synedra sp. etc possess potentials to be used as bioindicators to nutrient enriched ecosystem and therefore, can serve as ecological tools to monitor water quality.
1 Introduction
Primary production by coastal phytoplankton contributes almost 15% of global oceanic production (Mukherjee et al., 2014). Phytoplankton are unicellular, pelagic (few species are also benthic) primary producers with communities composed of numerous species with a broad range of physiological responses to their environment (Pinckney, 1999). Due to their ephemeral life span, phytoplankton can respond quickly to subtle changes in their environment and such responses may serve as indicators for significant physical, chemical or biological changes happening in the water column (Hotzel and Croome, 1999).
There have been a plethora of researches and experiments on the diatom serving as indicators of their respective ecosystem. Armstrong and Brasier (2005) studied the role of phytoplankton (diatom) as indicators of the palaeo environmental changes in Malden. So did Meyer (2002) in Ohio. Role of diatoms as indicators of coastal palaeo-environments and relative sea level changes was extensively studied by Stevenson and Pan (1999). Tomas et al. (1999) studied the role of nutrients in regulating the phytoplankton (diatom) blooms in Florida Bay.
The objectives of this study were to find out the influences of selected chief abiotic factors on seasonal fluctuations in the phytoplankton community in the tropical well mixed waters of the Hooghly estuary.
2 Materials and Methods
2.1 Study area
The sampling stations were Kachuberia [21°51'39"N 88°8'37"E], Chemaguri [21°40'43"N 88°7'28"E] and Gangasagar [21° 38' 0" N 88° 5' 0" E] located in the Hooghly estuary (Figure 1). The selection of these locales were mainly based on their clearly discernible salinity differences and mangrove vegetation covers, ranging from region with high riverine influence (Kachuberia) as mangrove impoverished zone, to brackish water regions and mangrove vegetation (Chemaguri) and marine dominated region (Gangasagar) with sparse mangrove cover. Three stations at Chemaguri were chosen to be sites with mangrove vegetation dominance [21°40'43"N and 88°7'28"E, 21°40'48"N and 88°09'.04"E, 21°40'57.54"N and 88°09'9.49"E]. Results from mangrove dominated regions and mangrove impoverished regions were grouped under the two headings and average data from the stations under respective groups were used for the present manuscript. The Hooghly estuary extends approximately between 21°32’-22°40’N and 88°05’-89°00’E with its lower stretches encompassing the thick mangrove vegetation, the Sundarbans. The north east coast of the Bay of Bengal is highly irregular near the land-ocean boundary and is dissected by a large number of strewing rivulets, creeks and tributaries. The Hooghly estuary exchanges flow with the Bay of Bengal near the Sagar Island and its tidal domain for nearly 250 Km. the mouth of the estuary has a funnel shape and the predominant tidal regime is semidiurnal in nature. This is a well mixed estuary due to the intense tidal and wave actions with a meso-macrotidal setting (2.5-7m amplitude). The climate of this region is characterized by the southwestern monsoon (July-October), northeast monsoon or post monsoon (November-February) and premonsoon (March-June); at least 70-80% of the rainfall occurs during the summer monsoon (SW monsoon), resulting in the high river discharge (2952-11897 m3s-1), which gradually diminishes to 900-1500 m3s-1 during non-monsoonal months (Biswas et al., 2004; Mukhopadhyay et al., 2006).
.jpg) Figure 1 Map of the study sites with sampling stations (black blotches). Three primary sampling stations were selected due to their variation in salinity, ranging from river dominated (Kachuberia), brackish water (Chemaguri) and up to marine influenced (Ganga Sagar). The entire Hooghly estuary was devastated by a severe tropical super cyclone and the study performed on it should help to find valuable information about the effect of such a catastrophe on microphytoplanktons population of a well mixed estuary (Hooghly estuary is one of the most important part of the largest deltaic system in the World) |
2.2 Data collection and sample analysis
Monthly data of surface water salinity, air temperature, water temperature, wind speed, dissolved oxygen, primary productivity and essential nutrients (nitrate, phosphate and silicate) were recorded and monthly phytoplanktonic sampling was performed from study sites for a total period of two years from November 2012 to October 2014. The essential meteorological back ground data of the days of the collections were procured from the usage of SHIMADZU Weather Station. Salinity of the water was first measured with the aid of refractometer and then estimated using argentometric method and the factor corrected values were put in.
Water sample for the estimation purposes was collected using the Niskin water sampler. For the estimation of phosphate, nitrate and silicate, the standard methods were followed (Grasshoff et al., 1983). Gross primary production and community respiration were measured in situ using the light and dark bottle method (Strickland and Parsons, 1972). The phytoplankton (diatom) sampling was performed using a handheld net [phytoplankton net (bolting silk no. 30, mesh size 20 µm) equipped with flow meter] from different stations in the Hooghly estuary. The mesh size was fixed for the microphytoplankton and not the nanoplanktons to maintain a certain degree of separation during the study and also due to the reason that increased turbidity rendered the usage of smaller mesh size impossible due to large quantities of silt clogging. The chief gear used in this purpose was country boats to ensure the least disturbance of the prevalent population of phytoplankton. After the collection, the phytoplankton concentrates were transferred into 25 ml TARSON polythene containers and 4% formalin along with Lugol’s iodine were used as preservatives depending on the need of clarification and specific preferences. The formalin is a very good agent for clearing cells off organic debris but it doesn’t stain cells hence it is hard to discriminate between living, viable cells from dead, resuspended ones (Mukherjee et al., 2013). The samples were then analyzed under light microscopes, bright field microscopes and phase contrast microscopes for their accurate and proper identification, using proper literature (effective and valid) (Desikachary, 1986-89; Hasle and Syvertsen, 1997; Al-Kandari et al., 2009).
Another method for the quantification of phytoplankton was used where 1 L water samples in triplicates were collected; each preserved with Lugol’s iodine solution and buffered formalin. After 72 hrs of sedimentation, the supernatant was filtered off (20 µm) and the phytoplankton (diatoms, flagellates and dinoflagellates) were enumerated in a Sedgwick Rafter counting chamber. The data generated from both the methods were tallied and the deviation was negligible ensuring accurate enumeration.
2.3 Data compilation and statistical analyses
All data tabulation and compilation were accomplished using the MS-EXCEL software.
3 Results and Discussion
Estuarine environment are subjected to varied changes in physicochemical properties due to continuous mixing of fresh and marine water. Estimation of the water quality variables is very important in assessing the quality of ecosystem (Chang, 2008). Fluctuation in pH values in the different seasons of the year is attributed to various factors such as assimilation of CO2 by photosynthesis through degradation of bicarbonates, dilution of seawater by freshwater influx, salinity fluctuations, low rate of primary productivity, high rate of respiration, temperature variations controlling the air water exchange of CO2 through the modifications of its partial pressure and disassembly of organic compounds by decomposers (George et al., 2012).
Higher pH (Figure 2) was observed during post monsoon and premonsoon periods, while monsoon months recorded the lowest, with the seasonal values ranging from 5.18 to 7.93. During the monsoon large amount of freshwater reduced salinity as well as erosional run-off due to the rain and increased turbulence mediated rise in turbidity caused the anaerobic semisolid bed to flush up and enter the upper water columns. The soil around the mangrove forest as well as of the river bed is highly anaerobic and is enriched with humic acid and tannic acid. testimonial to the degradative action of decomposing microbes. This on a local scale on average affects the overall pH of the water, bringing it down considerably. This was corroborated by Prabu et al. (2008) who studied that during premonsoon and post monsoon, the negative logarithmic concentration of free hydrogen ions increased due to the obvious increase in salinity and also due to high photosynthetic activity consuming the bicarbonate to assimilate CO2 in carbohydrates. Kachuberia exhibited lowest pH of 5.63 and highest of 6.58. Gangasagar, being one of the highest saline zones exhibited 6.79 and 7.93 as the lowest and highest pH values respectively. In spite of its situation between Kachuberia and Gangasagar and boasting a prominent brackish water quality, Chemaguri, exhibited relatively lower values of pH (5.18 to 6.05). This is because of the presence of dense mangrove patches on the both sides of the creek as well as navigation induced frequent churning of shallow sediment bed leading to mildly acidic conditions.
.jpg) Figure 2 Spatiotemporal variation of pH in the well mixed waters of the Hooghly estuary (Nov., 2012 – Oct., 2014) |
The lowest salinity value (Figure 3) was recorded during the monsoon period, while the highest was recorded during the prime of premonsoon and also the post monsoon periods. Salinity is one of the most important factors for estuarine flora and fauna as it directly pertains to the osmotic stress encountered by them since it largely controls the physiological activities. The average highest and lowest values recorded ranged between 5.95 – 22.81 (Kachuberia = 5.95 to 18.77, Chemaguri = 9.54 to 20.45 and Gangasagar = 11.85 to 22.81). The immense riverine run off as well as substantial deluge dilutes the salinity of Hooghly estuary to a great extent during the monsoon months. In addition to that, longer spells of overcast conditions render evaporation low, a situation almost opposite to that encountered during premonsoon and post monsoon. During the post monsoon months, lower relative humidity and clearer sky aid in higher rates of evaporation. During the premonsoon months, the exorbitant heat itself tagged with high wind velocity accentuates the rate of evaporation thereby making the surface water more saline. Kachuberia exhibited lowest value of salinity followed by Chemaguri and Gangasagar because Kachuberia is predominated by river flow, Chemaguri being the intermediate zone and Gangasagar receiving the highest tidal influence.
.jpg) Figure 3 Spatiotemporal variation of salinities in the well mixed waters of the Hooghly estuary (Nov., 2012 – Oct., 2014) |
The study of the dynamics of biophilic elements (i.e. nitrogen, phosphorus and silicon) in coastal waters relate to the short term variability of the water chemistry, which is strongly influenced by the effect of the seasonal and tidal cycle and they along with other physicochemical parameters largely govern the population density of phytoplankton (diatoms) of a particular water body. Riverine transport is a principal pathway of particulates and dissolved elements from land to sea. Coastal ecosystems like estuaries, mangroves, salt marshes modify riverine nutrient fluxes to the sea significantly through biogeochemical processes (Soetaert et al., 2006; Liu et al., 2009). Such areas are highly dynamic in terms of productivity since there is abundant supply of resources in the form of nutrients owing their origin to both natural and anthropogenic activities. Nutrients can be limiting factors to phytoplanktonic growth and the proper maintenance of their physiological activities, which in turn can affect the carbon budget through hampered assimilatory processes such as photosynthesis.
Nitrate is considered to be one of the most important plant nutrients for the growth of phytoplankton and the most important limiting nutrient in marine systems (Collos and Berges, 2003). Dissolved nitrate is the main source of nitrogen for the production of amino acids and also nitrogen bases of DNA. Phytoplankton obtain this nutrient by osmotic uptake from the surrounding environment. On average the highest values of nitrate (Figure 4) were encountered during the monsoon period followed by premonsoon. The lowest values were recorded during post monsoon period. The reason behind the spiking of nitrate during premonsoon and monsoon is because of the rain washed river run off being added to the basin. The average highest and lowest values generally ranged between 11.84 to 21.67 µM (Kachuberia = 11.84 to 20.82, Chemaguri = 12.26 to 20.85 and Gangasagar = 13.89 to 21.67). The higher values were recorded at Chemaguri and Gangasagar compared to Kachuberia. Chemaguri, though being a highly tide-fed creek and partly cradled by mangrove forest, showed high amounts of nitrate concentration which can be explained due to the excessive churning of the bottom sediments although it is not as anthropogenically influenced as others.
.jpg) Figure 4 Spatiotemporal variation of nitrate-nitrogen concentration in the well mixed waters of the Hooghly estuary (Nov., 2012 – Oct., 2014) |
Dissolved phosphate-phosphorus is perhaps the most important controlling factor for the phytoplankton population. Apart from anthropogenic sources the only natural source of phosphate is the mineral apatite from which phosphate solubilizing bacteria generate organic phosphate (orthophosphates) through the synthesis of low molecular weight organic acids. Like the nitrate-nitrogen, the phosphate also follows a similar pattern of seasonal fluctuation on average. The average values recorded during the study range from 0.82 to 2.60 µM (Kachuberia = 0.82 to 1.98, Chemaguri = 1.24 to 2.45 and Gangasagar = 1.21 to 2.60) (Figure 5).
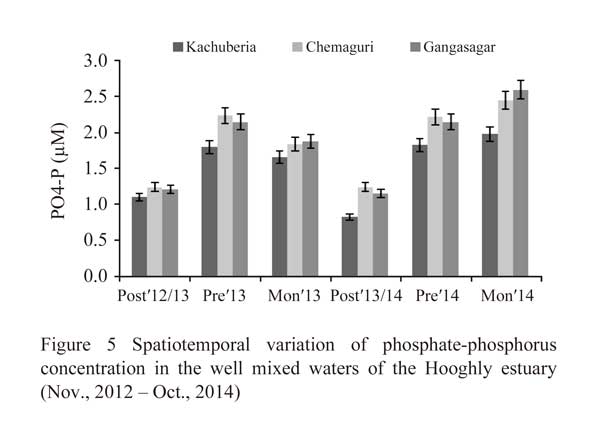 Figure 5 Spatiotemporal variation of phosphate-phosphorus concentration in the well mixed waters of the Hooghly estuary (Nov., 2012 – Oct., 2014) |
The rain during the premonsoon and monsoon washes out as well as floods large tracts of agricultural fields, thereby rinsing off the phosphate and adding to the basin and increasing its content. The lower values recorded during the post monsoon actually indicated the consumption of the nutrient by the phytoplankton and other photoautotrophic microbes in order to proliferate and also to some extent might have been due to the adsorption of the nutrient by the suspended particulate matter at the end of the monsoon months. Gangasagar exhibited the highest amount and Kachuberia the lowest. The reason behind Chemaguri, a small creek to exhibit high phosphate values is the presence of mangrove forest rhizosphere of which harbor the densest population of PSB, thereby increasing the dissolved phosphate load.
During the course of the study, the N: P ratio (Figure 6) was found to be lowest during the premonsoon and highest during post monsoon, with monsoon bearing intermediary values (ranging from 5.52 to 14.43). The N: P ratio was found significantly variable on both spatial and seasonal scale. Kachuberia exhibited of lowest and highest N: P ratio of 8.85 and 14.43 respectively. Similar values at Chemaguri and Gangasagar were 7.16 to 11.16 and 6.86 to 11.47 respectively. The relatively lower values of N: P ratio during premonsoon and early monsoon months could indicate that nitrogen and not phosphorous was the limiting factor of the trophic level as was also observed by (Biswas et al., 2010). During these periods, in spite of excessive input of dissolved inorganic nitrate and phosphate by both riverine and coastal influx, inadequate transparency hinders photosynthesis greatly along with phytoplankton growth. While in post monsoon periods, the conditions were reversed and that helped population explosion of phytoplankton enabling them to uptake more phosphate over nitrate thus, increasing the overall N: P ratio, at times approaching in the zone of the empirical 16:1 Redfield ratio. During monsoon, the ratio was found to be high as well, the reason of which could be the inorganic removal of phosphate through adsorption during the flocculation of suspended particulate matter.
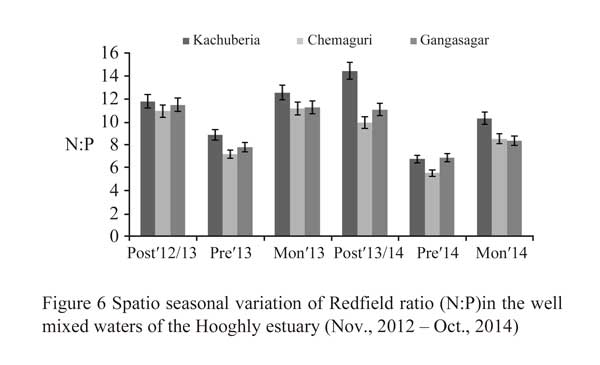 Figure 6 Spatio seasonal variation of Redfield ratio (N:P)in the well mixed waters of the Hooghly estuary (Nov., 2012 – Oct., 2014) |
Exclusively for the diatoms, some foraminifera and other minor silicoflagellates, dissolved silica serves as the chief governing nutrient parameter. Since their frustules are composed of nothing but hydrated amorphous silica. Presence and absence of silicate govern their population density and their ability to exploit silica determines their diversity. The highest concentration of dissolved silica was recorded during the monsoon and early post monsoon months, the premonsoon exhibited the comparatively lower values. The higher values during monsoon and post-monsoon were due to torrential downpours affected by the south-west monsoon as well as winter monsoon both of which erodes gargantuan amount of soil and adding clastic silica to the water body. The average values range between 49.58 to 91.06 µM (Kachuberia = 49.58 to 83.25, Chemaguri = 51.66 to 88.23 and Gangasagar = 54.32 to 91.06) (Figure 7). Here also Chemaguri exhibited similar patterns of phosphate, being higher than Kachuberia, while Gangasagar revealed the highest values. The reason Chemaguri exhibited higher values than Kachuberia is that being a shallow tidal creek and its bottom sediments get easily resuspended with the advancing tide and also silt from incoming tide as well as the egress from the hinterland channels being benign in nature gets deposited.
|
Figure 7 Spatiotemporal variation of silicate concentration in the well mixed waters of the Hooghly estuary (Nov., 2012 – Oct., 2014) |
Chlorophyll a concentration is one of the most important indicators of phytoplankton abundance and biomass in estuarine coastal waters, being their chief photosynthetic pigment (George et al., 2012). The highest chlorophyll concentrations were observed to encompass the very late monsoon to the post monsoon periods followed by the premonsoon months while lowest values were recorded during the peak of the monsoon period. In the Hooghly estuary there was a moderate variation Chl a concentrations between pre and post monsoons, lowest being in the monsoon proper (ranging from 4.29 to 13.73 mg m-3). Chlorophyll concentration is directly linked to the density of the cells bearing it. This was clearly evidenced from the increased values recorded from the premonsoon and post monsoon due to lower turbidity, high transparency and highly decreased values recorded during the monsoon due to the increase in riverine influx resulting in higher amounts of churning and resuspension, rendering the water highly turbid. The average spatial Chl a content during the study varied greatly (Kachuberia = 4.60 to 13.73, Chemaguri = 4.69 to 12.67 and Gangasagar = 4.74 to 15.13) (Figure 8). Chemaguri, being a tide dominated creek within a mangrove forest tract quite often encountered higher turbidity due to churning of river bed as well as soil “washout” from the mangrove forest.
Dissolved oxygen content of the water is the direct reflection of the primary productivity of any eco-region, more so in a dynamic system as that of a well mixed estuary (George et al., 2012). The chief impacting processes on D.O. are nutrient over enrichment upwelled organics from the coastal environment, advective organic compounds from swamps and mangroves and respiration by heterotrophic community. The scientific community is getting increasingly concerned over the incessant addition of nutrient from varied sources resulting out of everyday activity and having pervasive ecological effects on shallow estuarine and marine area (Diaz and Rosenberg, 1995). The average value ranged from 3.98 – 7.05 mg/litre (Kachuberia = 4.13 to 6.95, Chemaguri = 3.98 to 6.20 and Gangasagar = 4.47 to 7.05 mg/litre) (Figure 9). Oxygen has high solubility in low salinity zones the monsoon month recorded lowest values of D.O. Highest values of D.O. is recorded during the post monsoon and premonsoon periods. High nutrient content influences phytoplanktonic blooms which might have released more oxygen through photosynthetic activity as evidenced from primary productivity (Morgan et al., 2006). In addition to that lower temperature aided in greater O2 dissolution during the post-monsoon and early phases of premonsoon. During the late premonsoon and following monsoon months, the gradual rise in temperature, persistent cloud cover as well as high salinity rendered photosynthetic activity low and during the monsoon, the large river input in the form of land runoff added anaerobic soil and also caused resuspension of the sediment bed resulting in increased turbidity as well as higher rate of oxygen consumption by the aerobic decomposer bacteria and also extensive suspended particulate organic and inorganic matter can also adsorb oxygen. All these might have increased the rate of consumption of oxygen and thereby lowered D.O. content. The lowest values were recorded at Chemaguri while Kachuberia and Gangasagar exhibited more or less similar values. The reason behind Chemaguri being lowest is due to the fact that it is a shallow tidal creek with high levee on both sides. The water current is strong and disturbs the bed and resuspends the sediment inducing partial anaerobicity.
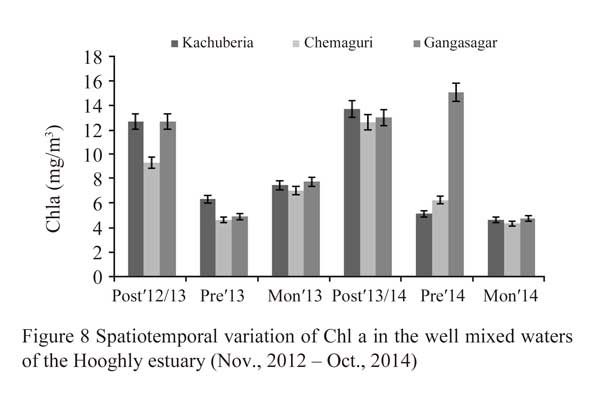 Figure 8 Spatiotemporal variation of Chl a in the well mixed waters of the Hooghly estuary (Nov., 2012 – Oct., 2014) |
.jpg) Figure 9 Spatiotemporal variation of Dissolved Oxygen content in the well mixed waters of the Hooghly estuary (Nov., 2012 – Oct., 2014) |
The population diversity of phytoplankton in Hooghly estuarine region followed the fluctuation pattern of Chl a throughout the tenure of the study. The higher values were encountered during the late monsoon to the whole of post monsoon period. Since, the Hooghly estuary is well mixed in nature, any physico-chemical influences over the surface also exerts similar influence at the bottom of the water column. During the course of the study, the lowest and the highest values recorded were 1.75 × 10⁴ and ~15.1 × 10⁴ respectively from the study area. Among the three stations, on average, Chemaguri exhibited lower values of phytoplankton density than the other two. This could be because of high tidal activity induced turbulence, extensively suspended particulate matter and high navigational traffic synergistically forcing lower photosynthesis and frequently disrupted plankton patches. Also to some extent the over arching mangrove forest cast prominent shadows during the photosynthetically active period of the day, a fact that could play its role in the relatively lower numbers of species individuals per litre of water. The other two stations being of much wider dimensions could nullify the prior mentioned effects adverse effects boast higher densities of phytoplankton (Kachuberia = 2.87 × 10⁴ to 14.62 × 10⁴, Chemaguri = 1.75 × 10⁴ to 15.10 × 10⁴ and Gangasagar = 2.58 × 10⁴ to 13.28 × 10⁴) (Figure 10).
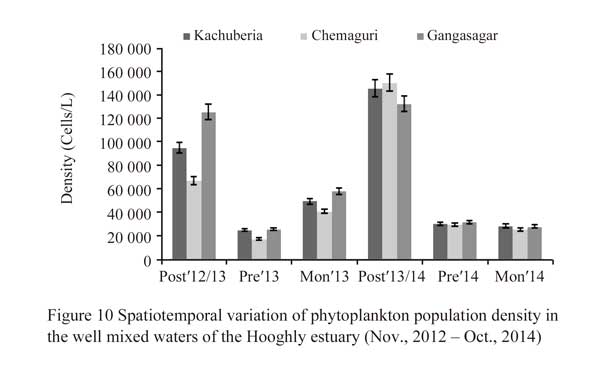 Figure 10 Spatiotemporal variation of phytoplankton population density in the well mixed waters of the Hooghly estuary (Nov., 2012 – Oct., 2014) |
Results of the large scale correlation (Table 1) between physicochemical parameters and phytoplankton population dynamics showed the following relationships: pH (-0.99 to +0.99), nutrients (nitrate = -0.69 to +0.99; phosphate = -0.61 to +0.16 and silicate = - 0.85 to + 0.76), and salinity (-0.74 to +0.96) all had significant influence on the population density. Chlorophyll a content (+ 0.85 to + 0.99), dissolved oxygen (-0.98 to+0.89), depended significantly on the population density of phytoplankton. This table furthermore emphasizes on the critically influential role of the meteorological and physico-chemical parameters on the population density of phytoplankton which in turn dictated the relationship with the biologically derived parameters and the ecological indices, simply highlighting the complexity and intricacy of various variables of the highly dynamic and well mixed Hooghly estuarine ecosystem.
|
Table 1 The following table illustrates the seasonal variation of correlation values among the selected physico-chemical and biological parameters of the well mixed Hooghly estuary |
The Table 2 depicts the species which had appeared in both the years of the study (2012-14) in at least one of the three seasons, with few appearing in all the three. These diatoms can best serve as indicators to the changes in their ambient environments. Species such as Coscinodiscus radiatus, Coscinodiscus marginatus, Coscinodiscus lineatus, Ditylum brightwellii, Skeletonema costatum, Thalassionema frauenfeldtii, Thalassionema nitzschioides, Synedra crystallinum etc are of more significance since they have been observed in both the years as well as all the three seasons, hence shall be able to reflect the effects of the seasonal changes in the selected physicochemical parameters on their composition and abundances and thus can be of greater use as bioindicators of well mixed tropical estuaries such as the one being dealt with presently. A very curious feature that can be observed from Table 2 is, almost all the species exhibited higher relative abundances in mangrove dominated waters than their abundances recorded from mangrove impoverished waters. Few species of Coscinodiscus, Thalassionema etc. however showed much higher abundances in mangrove impoverished waters. A correlation was performed among relative abundance values of those species of phytoplankton (diatoms) which were documented in both the years of the study. From the table it is quite apparent that the correlation values were largely significant and a more common trend was that a species exhibited highly negative and positive correlations for a particular parameter in mangrove dominated and mangrove impoverished and vice versa. This suggests that although the parameter is similar, its exploitation might differ in mangrove dominated and mangrove impoverished conditions since the species composition differed leading to different interspecific competition stress. All the diatom species have expressed significantly high correlation values with nutrients but very few have actually reflected a constant trend to be utilized as indicators to specific conditions. But the ones that have expressed such affinities possess the potential to truly serve as bioindicators of well mixed estuarine aquatic ecosystems.
|
Table 2 Major diatoms species and their responses to various nutrient fluctuations in mangrove dominated and impoverished waters of Hooghly estuary, through the correlation with the nutrients contents and relative abundances
|
.png)
4 Conclusion
The population dynamics of phytoplankton were largely governed by the physicochemical variables. The seasonal variation of these parameters in relation to the phytoplankton (diatoms) population dynamics was observed to be largely related. The study showed the seasonal fluctuations in the Redfield ratio (N: P) in the well mixed waters of the study sites in Hooghly estuary varied from 5.52 during premonsoon to 14.43 during monsoon. The relatively lower values of N: P ratio during premonsoon and early monsoon months could indicate that nitrogen and not phosphorous was the limiting factor of the trophic level whereas in post monsoon periods, the conditions were reversed and that helped population explosion of phytoplankton enabling them to uptake more phosphate over nitrate thus, increasing the overall N: P ratio, at times nearing the zone of the empirical 16:1 Redfield ratio. During high premonsoon and monsoon proper, the water was either highly saline or very low in salinity tagged with high or poor nutrient enrichment, high to low transparency, turbidity and other constraint extremes rendering the situation stressful for a wide spectrum of planktonic species assemblage, favoring either stenohaline or obligate freshwater species. The post monsoon however, advertised scenarios where the water became conducive for growth and development of various diatoms, dinoflagellates and cyanophycean phytoplankton altogether. Results also exhibited that diatom species of mangrove dominated estuarine ecosystems like Skeletonema sp., Thalassionema spp., Synedra sp. etc possess potentials to be used as bioindicators to nutrient enriched ecosystem and therefore, can serve as ecological tools to monitor water quality.
5 Acknowledgement
The financial aid from Central Scientific and Industrial Research (CSIR), New Delhi, India, Sanction No 24(0330)/14/EMR-II dated. 23.04.2014 is gratefully acknowledged. It is always hard to work in the remote and partly inaccessible islands of the Sundarbans by road and the financial support is immensely appreciated for the smooth running of the study. We also owe our sincere gratitude to the department of forestry of West Bengal, India for providing us with the opportunity to work in the Sundarban deltaic region.
References
Al-Kandari M., Al-Yamani F.Y., and Al-Rifaie K., 2009, Marine Phytoplankton Atlas of Kuwait’s Waters, Kuwait Institute for Scientific Research
Armstrong H.A., and Brasier M.D., eds., 2005, Microfossils, Blackwell Publishing, Malden, Oxford, pp. 296
Biswas H., Dey M., Ganguly D., De T.K., Ghosh S., and Jana T.K., 2010, Comparative analysis of Phytoplankton composition and abundance over a two decade period at the land-ocean boundary of a tropical mangrove ecosystem, Estuaries and Coasts, 33(2): 384-394
http://dx.doi.org/10.1007/s12237-009-9245-x
http://dx.doi.org/10.1007/s12237-009-9193-5
Biswas H., Mukhopadhyay S.K., De T.K., Sen S., and Jana T.K., 2004, Biogenic controls on the air-water carbon dioxide exchange in the Sundarban mangrove environment, northeast coast of Bay of Bengal, India, Limnology and Oceanography, 49: 95-101
http://dx.doi.org/10.4319/lo.2004.49.1.0095
Chang H., 2008, Spatial analysis of water quality trends in the Han River basin, South Korea, Water Research, 42: 3285-3304
http://dx.doi.org/10.1016/j.watres.2008.04.006
Collos Y., and Berges J.A., 2002, Nitrogen Metabolism in Phytoplankton, EOLSS Publishers, Marine Ecology, Oxford
Desikachary T.V., 1986-89, Atlas of diatoms 1-6, 809 plates, Madras Science Foundation, Madras
Diaz R.J., and Rosenberg R., 1995, Marine benthic hypoxia: a review of its ecological effects and the behavioural responses of benthic macrofauna. Oceanography and Marine Biology, 33: 245-303
George B., Nirmal Kumar J.I., and Kumar R.N., 2012, Study on the influence of hydro-chemical parameters on phytoplankton distribution along Tapi estuarine area of Gulf of Khambat, India, Egyptian Journal of Aquatic Research, 38: 157-170
http://dx.doi.org/10.1016/j.ejar.2012.12.010
Grasshoff K., Ehrhardt M., and Krembing K., 1983, Methods of seawater analysis, Verlag 2nd Edn. Chemic, Weinmeim, Germany
Hasle G.R., and Syvertsen E.E., 1997, Marine diatoms, In: Tomas C.R. (eds.), Identifying Marine Phytoplankton, Academic Press, London, pp 5-385
http://dx.doi.org/10.1016/B978-012693018-4/50004-5
Hotzel G., and Croome R., 1999, A Phytoplankton Methods Manual for Australian Freshwaters, Land and Water Resources Research and Development Corporation (Australia) Publication, OP22/99: 66
Liu X., Wang M., and Shi W., 2009, A study of a hurricane Katrina-induced phytoplankton bloom using satellite observations and model simulations, Journal of Geophysical Research, 114: C03023, doi: 10. 1029/2008JC004934
Meyer H., Siegert C., Derevyagin A., Schirrmeister L., and Hubberten H.W., 2002, Paleoclimate reconstruction on Big Lyakhovsky Island, North Siberia-Hydrogen and oxygen isotopes in ice wedges, Permafrost and Periglacial Processes, 13: 91-103
http://dx.doi.org/10.1002/ppp.416
Morgan A.M., Royer T.V., David M.B., and Gentry L.E., 2006, Relationships among nutrients, chlorophyll-a, and dissolved oxygen in agricultural streams in Illinois, Journal of Environmental Quality, 35: 1110-1117
http://dx.doi.org/10.2134/jeq2005.0433
Mukherjee A., De T.K., Das S., and De M., 2014, Tropical cyclones might seem to affect pennate diatoms more than their centric counterparts in well mixed counterparts, American International Research Journal in Formal Applied & Natural Sciences, 8(1): 31-40
Mukherjee A., Das S., De M., Maiti T.K., and De T.K., 2013, A Report on the Micro-Phytoplankton Size Range, Biovolume, Biomass and Geometric Shape in the Post “AILA” (Severe Cyclone) Waters of Estuarine Sundarban-Bay of Bengal, India, Journal of Marine Biology and Oceanography, 2: p 4
Mukhopadhyay S.K., Biswas H., De T.K., and Jana T.K., 2006, Fluxes of nutrients from the tropical River Hoogly at the land– ocean boundary of Sundarban, NE coast of Bay of Bengal, India, Journal of Marine Systems, 62: 9-21
http://dx.doi.org/10.1016/j.jmarsys.2006.03.004
Pinckney J.L., Paerl H.W., and Harrington M.B., 1999, Responses of the phytoplankton community growth rate to nutrient pulses in variable estuarine environments, Journal of Phycology, 35: 1455-1463
http://dx.doi.org/10.1046/j.1529-8817.1999.3561455.x
Prabu V.A., Rajkumar M., and Perumal P., 2008, Seasonal variations in physico-chemical parameters in Uppanar estuary, Cuddalore (southeast coast of India), Journal of the Marine Biological Association of India, 50 (2): 161-165
Soetaert K., Middelburg J.J., Hei C., Meire P., Van Damme S., and Maris T., 2006, Long-term change in dissolved inorganic nutrients in the heterotrophic Scheldt estuary (Belgium, The Netherlands), Limnology and Oceanography, 51: 409-423
http://dx.doi.org/10.4319/lo.2006.51.1_part_2.0409
Stevenson R.J., and Pan Y., 1999, Diatoms as indicators of coastal palaeo-environments and relative sea-level change, In: Stoermer E.F. and Smol J.P. (eds.), The diatoms: Applications for the environmental and earth sciences, New York, Cambridge University Press, pp. 277-418
Strickland J.D.H., and Parsons T.R., eds., 1972, A practical handbook of water analysis, Fisheries Resource Board, Canada
Tomas C.R., Bendis B., and Johns K., 1999, Role of nutrients in regulating plankton blooms in Florida Bay, In: Kumpf H., Steidinger K., and Sherman, The Gulf of Mexico Large Marine Ecosystem. Assessment, Sustainability, and Management, Malden, Blackwell Science, pp 323-337


. PDF(602KB)
. HTML
Associated material
. Readers' comments
Other articles by authors
. De T. K.
. Mukherjee A.
. Das S.
. Chakraborty Chakraborty S.
. De M.
. Maiti T.K.
Related articles
. Interrelation
. Diatom
. Physico-chemical parameter
. Mangrove
. Estuary
. Sagar Island
Tools
. Email to a friend
. Post a comment