Research Article
Growth Aspects of Giant Mantis Shrimp Harpiosquilla raphidea Fabricius, 1798 Banten Bay Waters, Banten Province 
2 Departement of Biology, Faculty of Mathematics and Natural Science, Universitas Indonesia, Depok, 16424, Indonesia
3 Department of Aquatic Resources Management, Faculty of Fisheries and Marine Sciences, Bogor Agricultural University, Kampus FPIK-IPB,Darmaga,Bogor 16680, Indonesia
 Author
  Correspondence author
International Journal of Marine Science, 2016, Vol. 6, No. 32 doi: 10.5376/ijms.2016.06.0032
Received: 25 Apr., 2016 Accepted: 20 Sep., 2016 Published: 20 Sep., 2016
Mulyono M., Patria M.P., Abinawanto., Affandi R., and Heriyansyah F.A., 2016, Growth Aspects of Giant Mantis Shrimp Harpiosquilla Raphidea Fabricius, 1798 Banten Bay Waters, Banten Province International Journal of Marine Science, 6(32): 1-14 (doi: 10.5376/ijms.2016.06.0032)
The study aims to assess the distribution of population structure, length-weight relationship, condition factor, growth parameters and exploitation rate of giant mantis shrimp (Harpiosquilla raphidea). This research was conducted in Banten bay waters, Province of Banten, from December 2011 to December 2012 and partially carried out periodically. The length was measured from the tip of the rostrum to the end of telson using a vernier caliper and the weight was measured to the nearest 0.01g using an electronic balance. The result shows in differently in group size distribution and is totally clear between the mantis shrimp which was caught in Banten bay and in Kuala Tungkal, Province of Jambi.
The growth aspect of mantis shrimp has the same relative relations of length and weight between male and female shrimp as a pattern of allometric growth (-). In general, the rate of H.raphidea mantis shrimp growth is almost the same and has not much different from other mantis shrimp of the Stomatopods ordo, but it has a slightly longer life span which is 5.6 years to 6.7 years. The value of growth (K) of female shrimp is higher than the male due to the growth of gonadal and their reproductive organs, but from the condition factor the female shrimps obtain higher scores than the males, it means that the weight is also influenced by the gonads and reproductive organs of the female mantis shrimp. The value growth (L ∞) measured between male and female at the same range of 369.08 mm.
Introduction
The spread of the mantis shrimp in Indonesia is almost equal to the spread of penaeid shrimp group. Mantis shrimp genus Harpiosquilla in Indonesia spread from the east coast of Sumatra, northern coast of Java to Nusatenggara at a depth of 2-24 meters in subtidal and intertidal areas (Manning, 1969). Mantis shrimp will grow as individual throughout their lives so that the growth is an aspect of biology shrimp that was studied intensively. Growth is one of the aspects that indicate the health shrimp’s condition individually as well as their population.
One of the aspects that influence the growth of mantis shrimp is habitat suitability. Habitat suitability is generally assessed by the water quality, substrate type and the availability of food resources (Wardiarno & Mashar, 2012).
The growth of mantis shrimp depends on the water environment condition. The growth can be defined as a change of size, both length and weight in certain period of time. Several factors interacted with other factor influencing the growth’s level such as level of competition, number and quality of consumed food, age, and stage of gonad maturity. (Moyle & Cech, 1996)
The relations between the length and weight can provide the information regarding the shrimp’s condition. The weight will rise associated with the increment of length and volume or vice versa (Jennings et al., 2001). The aim to find the relations between the length and weight is to facilitate the conversion of length to weight or vice versa and to know ponderal index or factor conditions. Analysis of the relations between carapace length and the weight of individual shrimp for each species using the technique of exponential and linear relations (Pauly, 1989).
According to Kartini, (1998), the differences in length and weight relations of shrimp derived from a variety of waters caused by the differences in growth’s speed and long range shrimp that has been analyzed. The value of conversion between total length (L) against the body’s weight (B) is used as an indicator of growth (Sparre & Venema, 1999). Crustaceans usually get changed in shape during the growth, it is said as the relative or allometric growth.
Basically, the relative growth is not only a characteristic of crustacean but the skin of crustacean is relatively hard, and it facilitates to do the the measurement. The growth aspect data are very important and indispensable as the initial data in an effort to fisheries resources management through conservation and domestication.
Based on the importance of growth aspect data as a conservation effort to H. raphidea giant mantis shrimp in waters of Banten bay, then it shall be examined aspects of growth and reproduction. In general, the research of growth aspect of H. raphidea mantis shrimp is seldom conducted. Indonesia waters, especially in waters of Banten bay, research on population biology of H. raphidea giant mantis shrimp has not been done. This study aims to determine; 1) The sex ratio, 2) the size distribution of mantis shrimp in their habitat in Banten Bay, 3) the length-weight relations of H. raphidea mantis shrimp and 4) conditions factor and the growth patterns of H. raphidea mantis shrimp. The result is expected to be useful to formulate the first step in the management of H. raphidea mantis shrimp, both ecological and economic in particular in waters of Banten bay and in Indonesian waters in general.
Materials and Methods
Time and location of research
The study was conducted from December 2011 to December 2012 at the sampling location of mantis shrimp and the observation of water quality in waters of Banten bay, Serang Banten, Province of Banten Indonesia (Figure 1). For the analysis of growth’s aspects has been done in the Fish Health labotarorium at Jakarta Fisheries University (JFU).
|
Figure 1 Mantis shrimp sampling sites and parameters of marine environment in Banten bay (5 57 -6 ° 01 ° S and 106 ° 8-106 ° 13 EL) Serang, Province of Banten |
.png)
The equipment and materials of research
The tools used are obscene nets, basic net (bottom net) operated pulled by a motorboat, GPS, multi checker, water quality, plastic bags, plastic mica, rubber bands, cool Box, scales, rulers and digital cameras. Materials used are H. raphidea mantis shrimp, 10% of formalin and oxygen gas.
Methods of work
Sampling is done directly by selecting the station location purposively. 6 (six) locations have been stipulated as the sampling station by considering the aspect of condition of the waters and the intensity of mantis shrimp fishing in Banten bay. According to the said consideration, the six substations are described as follows:
Substations 1, 3 and 5 are in waters with a depth of <5 meters and has a sandy mud substrate type, representing the intertidal habitat.
Substations 2, 4 and 6 are in waters with a depth of> 5 meters and has a muddy sand substrate type represents the subtidal habitat.
Sampling shrimp with the help of fishermen using fishing gear nets and basic nets that is actively operated at the determined coordinates using GPS, so for the guidance in the next sampling.
Basic net, actively operated using the net horizontally for 30 minutes at each research station at 06:00 to 08:00 am. Catch sample separated by the catching station, then put in a cool box that has been marked with the name of sampling stations.
Data retrieval of aquatic environment condition (physical and chemical parameters) is performed at each research station based on the position coordinates of shrimp sampling. Data retrieval of environment has been done in every station.
Measurement of environmental conditions at each station was done after fishing mantis shrimp at 7 to 8 am. Measurement of water environmental condition was conducted at the site of mantis shrimp fishing by using multiple gauges. The environmental monitoring methods in waters was measured by its temperature, depth, current speed, type of substrate, turbidity, pH, dissolved oxygen and salinity refers to Bengen, (2000).
The result of measurement of water quality parameters is presented in table form to facilitate data analysis while the sample of substrate and makrobentos using 10% formalin as preservative which carried out by the service of laboratory of PKSPL-IPB Bogor.
Mantis shrimp catches is then conducted by the dry system transport, shrimps which have been caught, were put into a mica plastic to reduce the movement and avoid the violence amongst the shrimps. Further, every 10-20 were put into a plastic bag that has been filled with the ice cube to lower the temperature and the oxygen also given into the plastic bag. This is the way how to transport with the hibernation process that can last 8-10 hours and that the shrimps are still alive upon reaching the destination.
Measurement of total length and weight of the shrimp is done in the laboratory, first done with sex determination and measurement of body length with the term of Kubo body’s length (BL), a body length is measured from the tip of the rostrum to posterior (Ohtomi & Shimizu, 1994; Kubo et al., 1959).
BL mantis shrimp is measured using a digital caliper with accuracy factor of 0.01 mm; while the weight of caught mantis shrimp weighed using precision digital scales with a factor of 0.1 grams. The resulting value of length and weight, and the observations gender of mantis shrimp are presented in table that will be used as the basis for the distribution and growth data analysis. Once measured and weighed, the adult shrimp with size ranging 100 mm - 350 mm length further used as the reproduction biology aspect sample.
Data Analysis
Hoses class of shrimp size is based on the total length and is determined using statistical calculation according to Walpole, (1995).The b value can be obtained from the correlation of length and weight (Effendie, 1997). B Value obtained is used to estimate both analyzed parameters, through the hypothesis:
1) b = 3 shows that the long growth is in line with the growth pattern of weight and its growth pattern called as isometric.
2) b ¹ 3 shows that the long growth is not in line with the weight growth is called allometric growth. When b> 3: the gain weight faster than growth, length (allometric positive). When b <3: the length growth faster than the weight growth (allometric negative).
3) The conclusion of b value was tested by t test at 95% confidence level (a = 0.05).
Hypothesis:
H0: b = 3 (isometric growth pattern) If t
H1: b ¹ 3 (allometric growth pattern) If t > t table then reject Ho
The relations between the length and weight of the shrimp is indicated by the correlation coefficient (r) which were obtained r value closes to 1 indicating the relations between the two variables is strong and there is a high correlation, but if r closes to 0 then the relations between the two is very weak or almost non-exist (Walpole, 1995).
The conclusion of b value was tested by t test at 95% confidence level (a = 0.05).The condition faktor (K) is calculated based on the length and weight of the shrimp’s sample. If b value = 3 (isometric growth), then condition factor is (KTL) calculated using the formula (Effendie, 1997).
Information:
K =conditions factor
W = body weight (g mol = body length (mm)
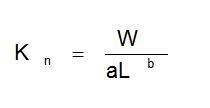
But if b ≠ 3 (the growth is allometric), then the condition factor (Kn) can be calculated using the formula:
The analysis of the frequency distribution is used to determine the distribution of the mantis shrimp based on size’s group. The analysis of frequency distribution was conducted using Battacharya methods (Sparre & Venema, 1999). Meanwhile, to determine whether there is a difference between sizegroup, t test was conducted on two different regression analysis based on Fowler and Cohen, (1992).
Growth coefficient of mantis shrimp is calculated using Von Bertalanffy Model (Sparre and Venema, 1999). L and K values were obtained from the calculation using ELEFAN I methods which is included in FISAT II program
Allegation of the group’s size is done by analyzing the length frequency data. Length frequency data were analyzed using the ELEFANI program (Electronic Length Frequency Analysis) of which is packaged in FISAT II program (FAO-ICLARM Stock Assessment Tool).
Data parameters of water’s chemical physics taken about 13 times (December 2011 to December 2012) or averaged replicates. The average data is processed by t test at 5% level to see if waters chemical physics parameters between different sampling locations are real or not. If the test results of 5% were significantly different from the real, the t test shall be continued at 1% level. Data retrieval of substrate was analyzed descriptively and with a triangle of land to determine the type of substrate, whereas for the various index analysis, dominant index and index referring to Shanon-Weibber.
Results
The total catches of mantis shrimp during research Number of H. raphidea mantis shrimp that were caught during the study, as many as 332. In addition, Harpiosquilla harpax and Miyakea nepa were caught. After the morphological analysis was done, it was obtained the percentage of these three kind of mantis shrimp located in waters in Banten bay which was consisted of Miyakea nepa 52 %, H. raphidea 28 % and H. harpax 20 %.
By morphology, H.raphidea and H. harpax shrimps were not much different. The main difference is in the back (dorsal), on the dorsal vertebra of H. raphidea mantis shrimp has clear pattern or line while on H harpax mantis shrimp there is no pattern or line and if touched was not rude. In brief, the overview of morphological differences on mantis shrimp’s type found in the waters of Banten bay (Figure 2)
The difference of Miyakea nepa mantis shrimp from H. raphidea mantis shrimp is significant enough, seeing from the shape and size of the arm sleeve. The arm or maxilliped consists of merus, propondus and dactylus, long propondus and dactylus are relative the same with H. raphidea and H. harpax shrimps, while comparing with Miyakea nepa, the length of dactylus is shorter or half longer from propondus, from the tip of telson’s form and telson’s color with black spot tail mark (Table 1).
|
Figure 2 The difference in character of telson and propondus (A) H. raphidea, (B) H. harpax and (C) Miyakea nepa. (Caption: arrowis (Y) telson and (X) propondus) |
.png)
|
Table 1 The difference of morfologyand the shape between H. raphidea, H. harpax and Miyakea nepamantis shrimp |
.jpg)
Sex Ratio
Sex ratio of mantis shrimp in Banten bay varies H. raphidea mantis shrimp sex ratio between male and female is 1: 1.3, while for H. harpax shrimp is 1: 1 and for Miyakea nepa shrimp is 1: 0.9 (Figure 3) Size distribution of Harpiosquilla raphidea mantis shrimps that were caught having size range in total length (TL) of 43.5 mm - 354 mm (Figure 4).
Based on the research station of the size composition caught in subtidal areas were 123 tails with total length of 121 mm - 134 mm onthe average value of long type of 127.5 mm was about 13 tails. Caught in the intertidal area 209 tailswith a dominated total length of 79 mm - 92 mm on the average value of 85.5 mm as much as 46 tails (Figure 4) Mantis shrimp catches based on the biggest sampling time was in November and the lowest was in June (Figure 5).
There are no real differences on size distribution of male and female in the intertidal and subtidal areas, the results of t-test on the analysis of the differences the two regressions showing no significant difference (confidence interval is 95%) on both regressions (Figure 6). The maximum length of mantis shrimp that was caught during the study is 354 mm. The long range shrimp male was 38 mm-- 354 mm, while the female mantis shrimp was 37-348 mm.
|
Figure 3 Composition of catches by sex of mantis shrimp in the waters of Banten bay |
.png)
|
Figure 4 Mantis Shrimp H. raphidea catches based on the length of middle class |
.png)
|
Figure 5 Mantis shrimp H. raphidea cacthes based on the catching time (month) |
.png)
The length-weight relations of Mantis Shrimp
The growth pattern of shrimp can be seen through the relations of its total length (mm) and its weight (gram), followed by the length-weight relations of the said shrimp, we can obtain the b value. The b value is growth’s indicator describing the tendency of length and weight of the shrimp.
In general mantis shrimp has b value = 2.63 and t test analysis against b value b obtained by t value
Length-weight relations by sex
The growth’s pattern of length and weight of shrimp analyzed through gender differences approach, this is done to determine whether there is difference between male and female mantis shrimp. Male has b value = 2.52 and female has b value = 2.78.
Length-weight relations of mantis shrimp based on group’s size and habitat
Length-weight of mantis shrimp was analyzed by grouping approaches with a simple measure of the length of class division. Grouping size is divided into three groups: small size with a total length of 37-134 mm, medium size of 135-246 mm and big size of 247-354 mm. The growth pattern of shrimp classified by size and type of habitat in this study is generally the same. Mantis shrimp male and female with small size, medium and big have allometric growth patterns (-). Value (R2) in mantis shrimp based on habitat and sex. There is no difference of small, medium and big size in the range of 0.82 to 0.95.
|
Figure 6 The Relations of total length-weight H. raphidea mantis shrimp of male and female combination |
.png)
Value Conditions Factor
Value conditions factor or male mantis shrimp (1.14) is slightly smaller than the female 1.17 (Figure 7).
|
Figure 7 Factor conditions of mantis shrimp based on sex |
.png)
The condition factor by sex and size
The condition factor of mantis shrimp is fluctuation by sex and size, the size of total length was made simply by dividing the three groups of size.
Three size groups by sex were obtained by the bigger condition factor on female small size, while the smaller was the female big size (Figure 8).
|
Figure 8 Factor conditions of mantis shrimp based by group of size in sex |
.png)
Condition factor of mantis shrimp based on sampling stations
Condition factor of mantis shrimp regardless of sex on intertidal habitat was biggerthan in the subtidal habitat. While by distinguishing sex obtained by condition factor value having the range of equal condition factor pattern between subtidal to interdal (Figure 9).
Growth Parameters of Mantis Shrimp
Based on the analysis of Ford-Walford plot obtained the value of growth parameters (K and ¥L) and to of mantis shrimp both on male and female as listed in Table 2.
|
Figure 9 Factor conditions of mantis shrimp based on sampling stations |
.png)
|
Table 2 Growth Parameters K, L∞and to H. raphidea mantis shrimp both male and female |
.jpg)
The value of the growth parameters used as the basis toobtain the equal of von Bertalanffy of mantis shrimp. The results of the analysis of growth parameters using ELEFAN I methods showed a growth model in male mantis shrimp Lt = 369.08 (1-e-0,16(t+0,575)), assuming that male mantis shrimps starting from a length of 0 mm at the age -0, in the next 16 months the shrimps will reach asymptotic length (L infiniti) as long as they depends on t oftheir growth coefficient’s value, while the growth model of female mantis shrimp Lt = 369.08(1-e-0,14(t+0,552)). Based on the equations of von Bertalanffy obtained the growth curve of mantis shrimp both male and female (Figure 10).
|
Figure 10 The growth curve von Bertalanffy obtained of mantis shrimp both male and female |
.png)
Environment Condition in Waters
The condition of marine environment is one of the factors that may affect the distribution of the size and growth patterns of shrimp.
The observation of waters quality condition in the study’slocation by site or location of observation and time, is still in quality standard for marine life. The observation of water quality is presented in Table 3.
The measurement result of several water quality parameter as seen on Table 3. generally shows the value of which is still in accordance with the sea water quality standard `for marine biota, including mantis shrimp. There are significant differences in the average value of brightness between intertidal and subtidal habitat. Differences in brightness values influenced by differences in organic matter and depth.
|
Table 3 The Measurement Result of Water Quality in the location of study |
.jpg)
Substrate type and abundance of macrozoobenthos
The results of the analysis of substrate type based on the percentage composition of sand, dust and clay described using triangles Muller (Brower & Zar, 1977). Substrate type on interdal station is different from the subtrate in subtidal habitat (Table 4). The results of the analysis of macrozoobenthos in subtidal and intertidal areas of each station varies (SD ±0,08 – 0,51) in terms of density, abundance and diversity of species.
|
Table 4 The composition of substrate at sampling stations |
.jpg)
Variations in density, abundance and diversity of macrozoobenthos closely related to the sediment of particle size, water depth and material content of sediment organic (Ishikawa, 1989).The relations between sediment particle size with macrozoobenthos community affects the abundance of an organism in waters (Kastoro, 1989). While Parker, (1975), found that the distribution of macrozoobenthos closely linked to the environmental conditions and the base of substrate.
Waters with strong currents will precipitate large particles by size. The clay substrate texture makes very little exchange of water at the bottom with water in the water column, so there is no input of oxygen. Organisms that live at the bottom generally adapt to different ways to get the oxygen from the water that is on the surface.
Diversity index (H`) of macrozoobenthos in the waters Banten bay ranges of 1.07 to 3.09. Uniformity Index Value (E) based on theobservation in theintertidal area was 0.79 and in subtidal area was 0.52 Dominant Index (C) rangesfrom 0.59 to 0.78 (Table 5).
|
Table 5 Density, Diversity Index (H '), Uniformity (E) and Dominance (D) Macrozoobenthos |
.jpg)
Density
According to Frenzy et al., (1983), there is relation between type of substrate with the population of makrozobentos, both by species composition, diversity and mass.
The correlation of abundance of Mantis Shrimp, Macrozoobenthos and Type of Habitat.
The correlation of abundance of mantis shrimp on macrozoobenthos dan its type of habitat is low, the range of correlation values in general is from 0.20 to 0.39. The correlation value between subtidal and intertidal habitats on the abundance is significantly different (P> 0.05), whereas the abundance of shrimp on the abundance of macrozoobenthos is significantly equal.
Discussion
The results of the analysis of connection between the length and weight of H. raphidea male mantis shrimp in Kuala Tungkal has b in range of value = 2.322 to 2.800 and the female range of value is also b = 2.366 to 2, 731 with negative allometric growth pattern (Wardiatno et al., 2012).
H. harpax in Banten Bay with a negative allometric growth pattern and with the b value of 2.8175 on female mantis shrimp, and 2.1567 on male mantis shrimp (Mayunar, 2002). In addition, there is a difference between the growth of male and female shrimp as well as between adult and juvenil shrimp. The relations between the body’s length and weight of crustacean commonly stated as allometric equation W = aLb, the relations of log W and log L is a linear regression relations with the value of b amounting 1. The value of the correlation coefficient was used to measure the extent to which the points accumulated around a straight line.
If the corellation reached +1 or -1, then the relations between the two variables which is stronng and there is high corellation between those two (Walpole, 1995).
The relations between the length and weight of the shrimp are indicated by the correlation coefficient (r) which were obtained. R value closes to 1 indicating the relations between the two variables which is strong and there is a high correlation, but if r closes to 0 then the relations between the two is very weak or almost non-exist (Walpole, 1995).
The growth pattern has huge effect to the population structure due to the dynamics of the stock, so it is necessary as a foundation in management. Sparre and Venema, (1999), stated that for the purposes of fisheries management, a subgroup of one species can be regarded as a stock if the differences in the group and the mixing with other groups can be ignored. To determine the pattern of growth, it needs to know other values, such as growth coefficient value (K), growth curve and the rate of exploitation.
The Value of growth coefficient (K) of mantis shrimp stomatopoda ordo generally has slightly different or almost the same (Mashar, 2010). Research on Squillamantis shrimp has obtained the value of growth coefficient on male shrimp growth of 1.6 and 1.3 on female shrimp growth per year (Abello &Martin, 1993). Dell and Sumpton, (1999) found1.52 of the value growth of mantis shrimp Oratosquilla stephensoni per year (0.13 per month).
Unlike the Oratosquilla oratory mantis shrimp that has a growth rate of slightly larger of 0.898 and 1.102 per year each for male and female (Ohtomi & Shimizu, 1994). While the H raphidea mantis shrimp in Kuala Tungkal Jambi coefficient of growth is1.4 per year for male and 1.1 for female per year (Wardiatno et al., 2012). The growth pattern has the role against the stock’s condition so it can be interpreted as a sub group of the species that has the same growth parameters and mortality, and inhabiting a particular geographical area (Welcomme, 2001).
The spread the mantis shrimp in Indonesia is almost equal to the spread of penaeid shrimp group. Sumiyono and Priyono, (1998), stated that mantis shrimp genus Harpiosquilla is a mantis shrimp often found in marine waters of Indonesia. During the study in Banten bay, it was found two species of Harpiosquilla genus, namely Harpiosquilla raphidea and Harpiosquilla harpax.
The difference of significant amount is the cacthes of Miyakea nepa mantis shrimp, this is due to the lower utilization rate of Miyakea nepa. Miyakea nepa mantis shrimp is a mantis shrimp with more shell composition than the meat (Moosa, 2001). Miyakea nepa mantis shrimp is not the main catch shrimp caught by the fishermen and often released back into the waters. In general, Miyakea nepa mantis shrimp that were caught shall be used as animal feed mixes. While the difference in cacthes of H. raphidea mantis shrimp with H. harpax in Banten bay is not significant, the difference in cacthes is equal to Mashar, (2010) in Kuala Tungkal and Malikusworo, (2000) in Jakarta bay.
The difference in catches of H. raphidea mantis shrimp was during the study period from May to June. This is due to the change of seasons which called.
Transitional monsoon of west to east season. The changes from west to east monsoon resulting poor water current (Sjaifuddin, 2007).
Mantis shrimp catches in the waters of Banten bay was relatively similar to the mantis shrimp catches in Kuala Tungkal (Mashar, 2010), where the transitional monsoon, the shrimp did not do any activity or more silent in the mud bottom waters. Size distribution with middle value of long type of 43.5 mm and 85.5 mm are young shrimp, this shows that in Banten bay waters are suitable habitat for mantis shrimp to live and grow.
The condition of Banten bay waters is a semi-enclosed waters so that waters environmental condition become dynamic.
The status of Banten bay watersthat is increasingly distressed by the amount of industrial activity along the western part of Banten bay yet has still little impact on changes in water quality (Sjaifuddin, 2007). Likewise, the results of research of PKSPL-IPB, (2010), stating the condition of Banten bay is still in accordance with the water quality standards for marine biota.
Length-weight relations between male and female mantis shrimp are based on the. The b value of is equal at the subtidal and intertidal habitat station, but the b value b of the female shrimp is different from the male. The equation length-weight relations of mantis shrimp weight have very close correlation in general.
It is based on when the correlation coefficient (r) is close to unity at all observation stations, both intertidal and subtidal. The magnitude of the correlation coefficient indicates that the length followed by weight gain, it is common in crustaceans experience changes in shape during growth (Hartoll, 1982)
The growth pattern of waters biota has allometric characteristic and in general caused by the over cacthes, competition and tropical potentian in a water condition (Moyle & Cech, 1996). By observing a condition of research area on mantis shrimp, the growth pattern has allometric characteristic and it is more due to high competition level both intra population and inter population such as shrimps, fish and living biota in the waters of Banten bay.
This is proved that during the investigation individual mantis shrimp that were caught has smaller number than the number of fish and other crustaceans. Considering this definition in general, mantis shrimp were not the main cacthes or it can be said as bycacth. The same result obtained on the research of mantis shrimp at Kuala Tungkal, Jambi using fishing gear and mini trawl that most of mantis shrimp is a byproduct of the catch (Mashar, 2010).
Other research shows that mantis shrimp is bycacth of ordinary big fishing gear (Dell & Sumpton, 1999; Zyndheen et al., 2004; Liu et al., 2007).
The maximum length value of alleged (L∞) H. raphidea male mantis shrimp is equal with the female, and the growth coefficient (K) is not much different between H. raphidea male mantis shrimp from and the female shrimp. Squilla mantis shrimp has growth coefficient value of 1, 6 per year (0.13 per month) on male and 1.3 per year (0.11 per month) on female (Abello & Martin, 1993). While H. raphidea mantis shrimp at Kuala Tungkal in Jambi, has also not much different, 0.14 per month for male and 0.11 for female (Mashar, 2010).
The similarity between the population of mantis shrimp in Banten Bay with that in Kuala Tungkal is due to habitat type and environmental condition that are relatively similar.
Comparing with the group of crustaceans outside Stomatopoda Ordo, the growth rate (K) of H. raphidea mantis shrimp is generally smaller, including Aristeus antennatus shrimp in the Western Mediterranean Sea with a value of (K) 00:25 for male and 0.3 for female (Cartes & Demestre, 2003). Pandalus borealis shrimp in Skjalfandi bay, North Iceland has the average growth rate (K) of 0.46 per month (Mamie, 2008). As for Penaeus shrimps, such as Penaeus indicus in Maputo bay in South Mozambique has the average growth of 0.39 per month (Franco et al., 2006).
The difference rate of growth of H. raphidea mantis shrimp which is included in Stomatopoda ordo with other shrimps groups outside Stomatopoda ordo allegedly caused by genetic factors, namely the difference in species and body size. This is according to the statement of Pauly, (1994) that from the data found by the difference rate of growth of aquatic biota may be caused by internal factors, including genetic factors that are generally and directly impose the limit on age and body size of the said biota.
Based on the growth curve of H. raphidea mantis shrimp, it can be seen that male mantis shrimp is faster (67 months) reaching the asymptotic length from the female mantis shrimp (80 months). This is due that female mantis shrimp has a coefficient smaller growth and too slow to reach L∞. In addition, the energy sources of the food consumed by the shrimp female are prioritized for the formation and maturation of gonads for the growth.
H raphidea mantis shrimp at the Banten bay has a life span of between 67-80 months and classified as long-lived organisms with slow growth. Based on Figure 10. curve von Bertalanffy that the first year of life phase H raphidea mantis shrimp has a rapid growth rate.
When entering the 2nd year, the growth of mantis shrimp began to decline, entering the next phase of the 3rd and so on the growth tends very slow and stagnant, comparing to other Squilla mantis shrimp mantis with a life-span of 1.5 years or 18 months (Abello & Martin, 1993), Oratosquilla oratory 3 to 3.5 years (Hamano et al., 1987) and Oratosquilla stephensoni with a life-span 2, 5 years (Dell & Sumpton, 1999).
Life-span H raphidea mantis shrimp is more longer than other mantis shrimps due to its maximum length of alleged of H raphidea shrimp (L∞) is more longer though its growth value (K) is relatively the same.
Diversity index of macrozoobenthos in intertidal habitats is larger than in subtidal habitat, diversity index difference was also followed by the uniformity and dominance index. The abundance of food resources in the intertidal habitat also affects the distribution pattern length of mantis shrimp. It can be concluded that the size distribution between intertidal and subtidal habitat is significantly different at the level of <0.05.
In addition of macrozoobenthos differences, the distribution’s difference of its length was aslocaused by the water conditions and substrate different.
The level of turbidity in Banten bay is affected by several rivers flowing and empties into Banten bay that affects the turbidity levels in Banten bay, mainly to estuaries area up to interdal area (Sjaifuddin, 2007).
In general, the rate of water parameters is in accordance with the results of PKSPL IPB 2010 stating the conditionof Banten bay waters is still in normal condition. Substrate type of coastal waters among others influenced by currents and waves.
In addition, it is also influenced by the flatness (slope) of beach. According to Sumich, (1992), the base substrate of waters in coastal area or estuaries consists of various types, among others: mud, sandy mud, sand and rocky.
Substrate type of Banten bay waters in this study is sandy clay loam and silt dusty. Substrate type of waters is strongly influenced by the strength and weak of the currents (Odum, 1971). The dominance of mud on the substrate in Banten bay was suspected by the input particle flows of the rivers located around Banten bay.
The correlation analysis result in substrate with an abundance of macrozoobenthos is significantly different due to a different substrate of clay or mud (Nasution, 2009).While based on a sampling substrate type to do with the abundance of macrozoobenthos and mantis shrimp deos not have any close correlation due to the by variationin the size of mantis shrimp that were caught by the type of macrozoobenthos.
According to Doi et al., (2005), macrozoobenthos can change based on the condition of waters spatially, and possibly a biota can consume type and kind of macrozoobenthos that is from different type based on the type and size or level biota. Some invertebara living in the waters have significant differences based on the spatial distribution (Rhicoux & Froneman, 2007).
Sex ratio in balance condition, Harpiosquilla raphidea giant mantis shrimp in Banten bay has quite extensive dissemination, ranging from intertidal to the subtidal area. Intertidal area is a care area for young shrimp.
In general, therate of growth of Harpiosquilla raphidea mantis shrimp is almost the same and not much different from other mantis shrimp from Stomatopods ordo, with a negative allometric growth pattern, but has a slighty longer life span which is 5.6 years to 6.7 years.
Acknowdgement
This article is part of the dissertation funded and facilitated laboratory equipment by Jakarta Fisheries University. Some is also sample mantis shrimp by BAPPL Serang, Banten
Abello, P& P. Martin. 1993. Fishery dynamics of the mantis shrimp Squilla mantis (Crustacea: Stomatopoda) population off the Ebro Delta. Fisheries Research16: 169--175.
http://dx.doi.org/10.1016/0165-7836(93)90048-C
Adirdja, S. 2010. Bahan dan alat penangkap ikan. STP Press. Sekolah Tinggi Perikanan Jakarta. Jakarta: vii + 235 hlm.
Ahyong, S.T. 2001. Revision of the Australian Stomatopoda Crustacea. Records of the Australian Museum26: 326 hlm.
Balai Penelitian dan Observasi Laut (BPOL) 2009. Peta sebaran klorofil wilayah Indonesia. http://www.bpol.litbang.kkp.go.id. 15 Desember 2011, pkl 22.00 WIB
Barber, P.H & M.V. Erdmann 2000. Molecular systematics of the Gonodactylidea (Stomatopoda) using mitochondrial cytochrome oxidase C (subunit 1) DNA squence data. Journal of Crustacea Biology20: 20--36.
Barber, P.H., S.R. Palumbi, M.V. Erdmann & M.K. Moosa. 2002. Sharp genetic breaks among populations of Haptosquilla pulchella(Stomatopoda) indicate limits to larval transport: patterns, causes, and consequences. Molecular Ecology11: 659--674.
http://dx.doi.org/10.1046/j.1365-294X.2002.01468.x PMid:11972755
Bengen, D.H. 2000. Sinopsis teknik pengambilan contoh dan analisis data biofisik sumberdaya pesisir. Pusat Kajian Sumberdaya Pesisir dan Lautan. Fakultas Perikanan dan Kelautan IPB. Bogor: 89 hlm.
Beverton, R.J.H. & S.J. Holt 1956. A review of methods for estimating mortality rate in fish populationwith special reference to sources of bias in catch sampling. Conseil Permanent International pour I’Exploiration de la Mer Rapports et Proces-Verbaux des Reunions140: 67--83.
Bhattacharya, C.G., 1967. A simple method of resolution of a distribution into Gaussian component, Biometric 23: 115--135.
http://dx.doi.org/10.2307/2528285
Brower, E. J. & J. H. Zar. 1977. Field and Laboratory Methods for GeneralEcology. W.M.C. Brown Company Publisher. Dubuque-IOWA: 194 hlm.
Chambers, S.M & J.W. Bayless. 1983. Systematic, conservation and the measurement of genetic diversity. Cummings Publishing Company Inc. New York: 87 hlm.
Doi, H., M. Masumasa, T. Toya, N. Satoh, C. Mizota, Y. Maki & E. Kikuchi. 2005 Spasial shifts in food sources for macrozoobentos in an estuarine ecosystem: Carbon and nitrogen stable isotop analysis. Estuarine, Coastal and Shelf Science 64: 316--322.
http://dx.doi.org/10.1016/j.ecss.2005.02.028
Dell, Q. & W. Sumpton. 1999. Stomatopod by-catch from prawn trawling in Moreton Bay. Autralia. Asian Fisheries Science12: 133--144.
Effendie, M.I. 1997. Metode biologi perikanan. Pusaka Nusatama Yogyakarta: 79 hlm.
Gulland, J.A, 1977 Fish population dynamics. The implications of management Ed ke-2. Jhon Willey and Sons: 345 hlm.
James, D.H. & P. Thirumilu., 1993. Population dynamics of Oratosquilla nepa in the trawling grounds off Madras. International Journal Biology Assesment. India. 35 (1 & 2): 135--140.
Jennings, S., M.J. Kaiser & J.D Reynolds. 2001. Marine fisheries ecology. Blackwell Science Ltd. Oxford. London: 212 hlm.
Kodama, K., T. Yamakawa, T. Shimizu & I. Aoki. 2005. Age estimation of the wild population of Japanese mantis shrimp Oratosquilla oratoria(Crustacea: Stomatopoda) in Tokyo Bay, Japan, using lipofuscin as an age marker. Fisheries Science71: 141--150.
http://dx.doi.org/10.1111/j.1444-2906.2005.00941.x
Kodama, K., T. Shimizu, T. Yamakawa & I. Aoki. 2006. Changes in reproductive patterns in relation to decline in stock abundance of the Japanese mantis shrimp Oratosquilla oratoriain Tokyo Bay. Fisheries Science72: 568--577.
http://dx.doi.org/10.1111/j.1444-2906.2006.01185.x
Krebs, C. J. 1989. EcologicalMethodology. Harper Collins Publisher: 654 hlm.
Kubo, I., S. Hori, M. Kumemura, M. Naganawa & J. Soedjono. 1959. A
biological study on a Japanese edible mantis-shrimp, Squilla oratoriaDe Haan. Journal Tokyo University of Fisheries45: 1--25.
Manning, R.B. 1969. A review of the genus Harpiosquilla (Crustacea: Stomatopoda) with description of three new species. Smithsonian Contribution of zoology. Smithsonian Institution Press. City of Washington: 41 hlm.
Manning, R.B. 1995. Stomatopoda crustacea of Vietnam: the legacy of Raoul Serene. Crustacea Research. Spesial no4: 1--339.
Mashar, A. 2011. Pengelolaan udang mantis (Harpiosquilla raphidea) berdasarkan informasi Biologi di Kuala Tungkal Jambi. Tesis. Institut Pertanian Bogor: 49 hlm.
Moyle, P.B & J.J. Cech. 1996. Fishes an introduction to ichtyology. Prentice Hall, New Jersey: 115 hlm.
Naamin, N.1984. Dinamika populasi udang jerbung (Penaeus marguensis De Man) di perairan Arafura dan alternatif pengelolanya .Disertasi. Sekolah Pasca Sarjana. Institut Pertanian Bogor. Bogor. xiv + 185 hlm.
Nasution, A. 2009 Analisi Ekologi Ikan Kurau pada Perairan Laut Bengkalis, Riau. Tesis. Ilmu Kelautan Fakultas Matematika dan Ilmu Pengetahuan Alam, Universitas Indonesia: 100 hlm.
Odum, E. P. 1971. Fundamentals of ecology, 3thEdition. Saunders
College. Publishing: Philadelphia: 474 hlm.
Ohtomi, J, & M. Shimizu. 1994. Teoritical growth during the recruitment period and estimation of growth parameters of the Japanese mantis shrimp Oratosquilla oratoria in Tokyo Bay. The of JournalUniversity of Tokyo58 (1): 21--27.
Pauly, D. 1989. A selection of simple methods for the assesment of tropical fish stock. Manual FAO, Fish Circulation., FIEI/C701: 325 hlm.
PKSPL (Pusat Kajian Sumberdaya Pesisir dan Lautan) IPB. 2004. Laporan akhir penyusunan rencana induk (grand desain) pengelolaan lingkungan hidup pesisir dan laut Propinsi Banten tahun anggaran 2004. Buku 1: Profil Lingkungan Pesisir dan Laut. Bogor. PKSPL. Institut Pertanian Bogor. Bogor: 122 hlm.
Powers, D.A. 1991. Evaluating genetics of fish. Advances Genetics29: 119--228.
http://dx.doi.org/10.1016/S0065-2660(08)60108-X
Rhicoux, N.B & P.W. Froneman. 2007. Assesment of spasial variation in carbon utilization by benhtic and pelagic invertebrates in a temperate South African erstuary. Coastal and Shelf Science71 : 545--558.
Sparre, P. E & S.V. Venema. 1999. Introduction pengkajian stok ikan tropis. Buku 1: manual. Kerjasama Organisasi Pangan dan Pertanian Bangsa-Bangsa (FAO) dan Pusat Penelitian dan Pengembangan Perikanan, Badan Penelitian dan Pengembagan Pertanian Jakarta, Indonesia: xix + 438 hlm
Walpole, R.E. 1995. Pengantar statistika (Terjemahan oleh Bambang Sumantri). PT. Gramedia Pustaka Utama. Jakarta: 515 hlm
Wardiatno, Y. & A. Mashar 2010. Biological information on the mantis shrimp, Harpiosquilla raphidea (Fabricius 1798) (Stomatopoda: Crustacea) in Indonesia with a highlight of its reproductive aspects. Journal of Tropical and Conservation 7: 63--73
Wortham-Neal, J.L. 2002. Reproductive morphology and biology of male and female mantis shrimp (Stomatopoda: Squillidae). Journalof Crustacean Biology22(4): 728--741.


. PDF(671KB)
. HTML
Associated material
. Readers' comments
Other articles by authors
. Mugi Mulyono
. Mufti Petala Patria
. Abinawanto
. Ridwan Affandi
. Firman Agus Heriyansyah
Related articles
. Growth Aspects
. Mantis Shrimp
. Harpiosquilla raphidea
. Banten Bay
. Banten Province
Tools
. Email to a friend
. Post a comment