In response to recent global increase in carbon dioxide emissions primarily from anthropogenic causes (
IPCC, 2001), the oceans are absorbing large amounts of carbon dioxide (CO
2) from the atmosphere. According to Fabry et al. (2008), the oceans have absorbed about 30% of carbon dioxide emitted into the atmosphere as a result of anthropogenic activities such as land use change, fossil fuel burning and cement production. The increased absorbance of carbon dioxide from the atmosphere has led to the changing of the chemistry of the oceans (
Fabry et al., 2008;
Cooley and Doney, 2009;
Kroeker et al., 2010;
Armstrong et al., 2012,
Turley and Gattuso, 2012), resulting in a parallel increase of hydrogen ion concentration and a consequent increase in acidity (
Armstrong et al., 2012); through reduction in seawater pH and saturation states for calcium carbonate minerals such as aragonite and calcite.
Ocean acidification is generally considered one of the multiple stressors affecting the oceans ecosystems (
IPCC, 2011). In addition to already existing stressors of the oceans such as over fishing and pollution, ocean acidification would pose multiple threats to marine species, biodiversity and the goods and services the oceans provide (
IPCC, 2011;
Rogers and Laffoley, 2011). Several authors such as Fabry et al. (2008); Sumaila et al. (2011) and Mohammed and Uraguchi (2013) have projected ocean acidification to have varying consequences and impacts on the marine ecosystem at large and fisheries in particular. Perry (2010) anticipates that developing countries, tropical nations and the poor would be at the worst receiving end of these varying impacts.
The impacts of ocean acidification on the marine ecosystem are multiple; ranging from affecting the physiology of fish species (
Dupont and Portner, 2013;
Portner et al., 2004;
Fabry et al., 2008) to reduction of calcification rates in calcifying organisms such as crustaceans and molluscs (
Vezina and Hoegh-Guldberg, 2008;
Barnard and Grekin, 2010), ripple effects in the ecosystem (
Hall-Spencer et al., 2008), food chains and webs (
Turley and Gattuso, 2012), to socioeconomic impacts on the livelihoods that depend on these fisheries (
Hilmi et al., 2012).
Ghana has a vibrant marine fisheries industry which is likely to be impacted by global climate change and ocean acidification. The Ghanaian fisheries sector plays an important role in national socioeconomic development objectives relating to food security, employment, Gross Domestic Product (GDP) and foreign exchange earnings. The dependence on fish and fishery products for livelihood and poverty reduction in Ghana cannot be taken for granted (
Asiedu and Nunoo, 2013). It is estimated that about 10% of the population depend directly or indirectly on fish resource, which translate to 2.6 million people of the current population of 26 million. Ghana, located in West Africa, has a coastline of about 550 km (
Tamakloe, 2009), and a very narrow and shallow continental shelf. The marine fishing industry consists of three main sub-sectors, namely, small scale (for artisanal or canoe), semi-industrial (for inshore) and industrial sub-sectors. The marine artisanal fisheries are characterized by the use of several gears that are operated from dugout canoes which is carved out of a single log of wood species called ‘wawa’
Triplochiton scleroxylon and ‘onyina’
Ceiba petandra. Gears such as beach serine, purse seine (APWs), gill net, lobster net are deployed by the artisanal fishermen. There are more than 12,700 canoes operating in 315 landing beaches and 190 fishing villages producing between 75 to 80% of the total marine fish landed (
Akyempon et al., 2014). The over three hundred locally made wooden vessels of the semi-industrial sector use in-board engines, operate from eight main landing sites along the coast and fish with either purse seine or trawl gears in coastal waters all year round.
On African coasts, few studies have been conducted pertaining to ocean acidification despite their biological and socioeconomic vulnerability to future global changes (
Lam et al., 2012;
Dupont and Portner, 2013). An improved understanding of how the biophysical impacts of ocean acidification would influence fish catches and fish protein supply and other economic activities generated by the world’s fisheries is therefore needed, especially in Ghana, where dependence on the fishing industry is very high. Assessments of ocean acidification impacts are also important for predicting future climate change and marine ecosystem responses (
Bates et al., 2012).
The primary objective of this study was to determine possible impacts of ocean acidification on the abundance and diversity of fin- and shellfish species in coastal waters of Ghana. The study has three specific objectives viz.: determine the extent and magnitude of impacts of ocean acidification on abundance and diversity of fish stocks through monitoring of physico-chemical parameters of the ocean; determine the abundance and species composition of landings of semi-industrial (trawlers) and artisanal (beach seine) fisheries and key species susceptible to ocean acidification; and determine species biomass and composition of ichthyoplankton in coastal waters susceptible to ocean acidification. This paper presents the findings of the first year out of on-going four years of primary and secondary data collection to determine the impacts of ocean acidification on fish biodiversity in Ghanaian coastal waters.
2 Materials and Method
2.1 Study design
A two-level sampling strategy was adopted for data collection. The first was a geographical stratification, which thus selected two geographical sites. The first site was the Teshie Sangonaa fish landing beach, located in Teshie, to represent the artisanal fishery, while the second site was the Tema Inshore fish landing beach in Tema, to represent the semi-industrial fishery. The second level of stratification was on seasonal basis, where data was collected in the lean and peak seasons. The lean fishing season usually runs from December/January to February/March while the peak fishing season usually runs from June/July to September/November (
MOFI, 2008).
2.2 Study sites
The Teshie Sangonaa landing beach is located within the Teshie Township, a suburb in the Greater-Accra Region of Ghana (
Figure 1). The beach is located at Latitude 05
o 35.004”N, Longitude 000
o 05.362”W and serves the artisanal fishers within the Teshie community for landing of their catch and the fishmongers who come there purposely to buy catch from the fishers.
The Tema Inshore fishing harbour is located within the Tema Inner fishing harbour, which provides a holding facility for semi-industrial and industrial fishing vessels (
Figure 1). It is located at Latitude 05
o38.264”N, Longitude 000
o00.595”E.
|
.png)
Figure 1 Map showing locations of study areas in Ghana
|
2.3 Biological/Physico-chemical data collection and laboratory procedures
2.3.1 Fish species composition
Monthly fish samples were collected from the artisanal fishery and semi-industrial fishery from January to December, 2013. A standard sample of one bucket, weighing an average of 8 kg when full, was taken from total fish caught in one haul by the artisanal fishery in Teshie and total fish landed by the semi-industrial fishery in Tema respectively before sorting by fishermen. The sample taken was then weighed in kg using a field hand scale KERN CH15K20, and kept on ice for about an hour of transportation to the laboratory. Samples were immediately identified, enumerated and weighed or otherwise kept in a deep freezer and analysed within 48 hours.
In the laboratory, fish species were sorted out and identification made to the lowest taxonomic level as much as possible using fish identification guides (
Schneider, 1990;
Kwei and Ofori-Adu, 2005). The weight of all individual fish species was taken using a PHILLIP HARRIS A20002 weighing scale in grams to two (2) decimal places. Sexes of fish were determined through manual sexing (
Nielson and Johnson, 1985). Total number of individual species as well as total weight were then quantified and extrapolated to the catch using the raising factor (R), which is obtained by dividing the total catch over the sampled catch.
2.3.2 Physico-chemical parameters
Seawater samples were collected within the perimeter where fishing occurred from which fish samples were taken, within the hours of 0700 and 0900 GMT, from a depth of between 2 and 3 centimetres beneath the water surface from both the artisanal and semi-industrial fisheries. Measurement of physical parameters such as temperature, salinity, pH and pressure were undertaken in situ offshore, aboard a motorised vessel with a HANNA 9828 multi-parameter probe. Three replicates of these readings were taken and three replicates of water samples also collected, using water sample bottles. The samples were kept on ice for transportation to the laboratory where they were preserved in a refrigerator at a temperature of 4oC and analysed within 48 hours of preservation.
Analysis of physico-chemical parameters was done using standard protocols according to APHA (1998). Nutrients (nitrates, phosphates, silicates and sulphates) and alkalinity analyses were carried out using Spectrophotometer DR2800 and alkalinity test kit respectfully. Iron, calcium, magnesium and carbon dioxide determination analyses were done using a photometer. Seawater partial pressure of Carbon dioxide (pCO
2), Dissolved Inorganic Carbon (DIC), Carbonate ion concentration [CO
23-], mineral saturation states for calcite (Ωcalcite) and aragonite (Ωaragonite), and the Revelle factor (β) were computed from pH, Total alkalinity, temperature, salinity and pressure data using the programme CO
2calc (
Robbins et al., 2010). Partial pressure of carbon dioxide, dissolved inorganic carbon, total alkalinity and the Revelle factor constituted seawater carbonate chemistry parameters, while pH, carbonate ion concentration, aragonite saturation state and calcite saturation state constituted ocean acidification parameters (
Bates et al., 2012). Samples were analysed for nutrients using standard protocols according to APHA (1998).
2.3.3 Ichthyoplankton biomass and composition
An ichthyoplankton net of 200 microns was towed in a step-oblique pattern within the perimeter of the beach seine haul for a standard total time of 18 minutes. This was within 10 m to 50 m depth. The net was lowered vertically, towed horizontally for 3 minutes, further lowered and towed horizontally again for 3 minutes until the standard 18 minutes, at a boat speed of 3 knots. Sample collects in the sampler of the net and this was backwashed into a sample bottle and fixed with 40% formalin for preservation.
In the laboratory, formalin was drained off the sample with a sieve of 500 microns and made up to 200 ml in a round bottom flask. Using a 10 ml measuring flask, 10 ml portions of the sample were taken and smaller portions of it poured in a petri dish and viewed under the microscope with a magnification of 4x to identify fish eggs and larvae. Identification of larvae was done to the lowest taxonomic level possible using FAO species identification keys (
Fischer et al., 1981). Calculations were then carried out to estimate the total biomass of fish eggs and larvae as follows (
Perry et al., 1993):
Total number of ichthyoplankton in 10ml of sample = a
Total number in 200 ml (N) = (200 x a) / 10 ml (this represents the total number of larvae in volume of seawater filtered by the net).
Volume of seawater filtered by the net (V) = RF m3
Where R = number of revolutions and F = flow meter constant given as 0.11960
Therefore the number of larvae per m3 of seawater = V/N
2.4 Data analysis
Statistical analyses were designed to assess the effect of the environmental variables and parameters that contribute to ocean acidification on the abundance and diversity of fish species in the two fisheries, and which species were being driven by those parameters. Species composition and abundance data and physico-chemical data were captured in Microsoft excel 2010 prior to analysis. The Shapiro-Wilk test (
Shapiro and Wilk, 1965) was used to test for normality of data, and after data proved to be non-parametric from the test, the Kruskal-Wallis H test was used to test for significant differences in relative abundance of species between seasons and fisheries, using the XLSTAT 2012 computer software. Margalef, Pielou, Shannon-Weiner and Simpson diversity indices were computed for fish data using the Diverse feature in Primer 6 software. A Principal Components Analysis (PCA) was then conducted to identify parameters with greater influence on variations in terms of abundance and diversity in the various sites using the RELATE and BVSTEP functions in Primer 6 software (
Clarke and Warwick, 2001). All environmental data was log transformed and normalised (logx+1) to take care of all zeros, while fish data was square root transformed in order to weight the contribution of common and rare species in the non-parametric abundance data before analysis in the Primer 6 software. A canonical correspondence analysis (CCA) using the CANOCO 4.5 software (
ter Braak, 1986) for Windows was then conducted to ordinate the principal variables identified from the PCA with the identified fish species.
|
.jpg)
Table 1 Mean (± standard deviation) values of physico-chemical parameters measured in the lean and peak seasons of both fisheries in the year 2013
|
3 Results
3.1 Physico-chemical parameters
Table 1 shows the mean and standard deviations of physico-chemical parameters measured for both the lean and peak fishing seasons of Teshie (artisanal fishery site which is nearer shore) and Tema (semi-industrial fishery site which is further offshore). Mean temperature values reduced from 28.03
oC in the lean season to 26.14
oC in the peak season. The semi-industrial fishery also experienced a decrease in mean temperature values from the lean season to the peak season.
Figures 2 and
3 show a decreasing trend of the seawater carbonate chemistry parameter total alkalinity, for both the artisanal and semi-industrial fishery. Dissolved inorganic carbon and partial pressure of carbon dioxide also show an overall decreasing trend, but tends to increase during the months of the lean seasons of the two fisheries, resulting in one major peak in the artisanal fishery and two major peaks in the semi-industrial fishery. Revelle factor for both fisheries however had an increasing trend.
Figures 4 and
5 also show a decreasing trend for the ocean acidification indicators (pH, aragonite saturation, calcite saturation, carbonate ion concentration) for both the artisanal and semi-industrial fisheries, with the semi-industrial fishery having two major peaks.
The observations in whole study showed that male individuals showed high density as compared to female individuals. High density of male individuals is due to some females dying after breeding. The male individuals were also larger in size as compared to female individuals, which was convenient in reproductive activity represents the sexual dimorphism. Difference in morphological sexual maturity was observed within sexes also. From the present study it is suggested that Ocypodid crabs can be used as pollution indicators for assessment of environmental health of our coastal areas.
|
.png)
Figure 2 Trend of seawater carbonate chemistry parameters for the artisanal fishery during the lean and peak fishing seasons of year 2013
|
Legend
L1 = first month of lean fishing season
L2 = second month of lean fishing season
L3 = third month of lean fishing season
P1 = first month of peak fishing season
P2 = second month of peak fishing season
P3 = third month of peak fishing season
P4 = fourth month of peak fishing season
P5 = fifth month of peak fishing season
|
.png)
Figure 3 Trend of seawater carbonate chemistry parameters for the semi-industrial fishery during the lean and peak fishing seasons of year 2013
|
|
.png)
Figure 4 Trend of ocean acidification indicators for the artisanal fishery during the lean and peak fishing seasons of year 2013
|
|
.png)
Figure 5 Trend of ocean acidification indicators for the semi-industrial fishery during the lean and peak fishing seasons of year 2013
|
3.2 Species composition and abundance
A total of 218 376 specimens representing 41 species from 22 taxonomic families were recorded at the end of the study from both artisanal and semi-industrial fisheries (
Table 2). Twenty five (25) species from 14 taxonomic families were recorded in the lean season while 28 species from 17 taxonomic families were recorded in the peak season for the artisanal fishery whereas 13 species from seven taxonomic families for the lean season and 12 species from eight taxonomic families for the peak season were recorded for the semi-industrial fishery. Out of the 41 species identified, nine of them, namely
Caranx crysos, Decapterus rhoncus, Ethmalosa fimbriata, Sardinella maderensis, Brachydeuterus auritus, Scomber japonicus, Sepia officinalis, Sphyraena sphyraena and Ephippion guttifer were found in both fisheries in either of the two seasons.
Decapterus rhoncus was, however, the only species present in both seasons for both fisheries.
|
.jpg)
Table 2 Occurrence of fish species in the artisanal and semi-industrial fisheries at Teshie and Tema respectively during the lean and peak fishing seasons of year 2013
|
Selene dorsalis and
Brachydeuterus auritus were the most abundant species in the artisanal fishery with relative abundances of 34.72% and 23.38% respectively, as shown in
Table 3. In the lean season,
S. dorsalis accounted for half of the fish catch composition with a relative abundance of 50.98% followed by
B. auritus.
B. auritus however dominated in the peak season with a relative abundance of 26.56% over 24.48% for
S. dorsalis. New species were also recorded in the peak season such as
Bathysolea albida,
Rhinobatos rhinobatos,
Chaetodipterus lippei,
Orcynopsis unicolor, and
Penaeus notialis, which were hitherto not recorded in the lean season, in relative abundances of 0.04%, 0.04%, 0.09%, 0.62% and 2.83% respectively.
Callinectes sapidus, a crustacean, which was in relative abundance of 0.04% in the lean season increased to 3.54% in the peak season. The differences between the relative abundances of species in the two seasons in the artisanal fishery were however found to be not significant (Kruskal-Wallis H test, df=1, P > 0.05).
|
.jpg)
Table 3 Species composition and relative abundance of species and families found in the artisanal fishery for year 2013
|
As shown on
Table 4,
Decapterus punctatus was the most abundant species for the semi-industrial fishery with a relative abundance of 45.35%. In the lean season, it accounted for 30.79% of fish catch, with
Sardinella aurita following with 19.81% as the next dominant species. In the peak season,
Decapterus punctatus constituted 46.41% of fish catches and 40.94% for
Sardinella aurita. Together, these two species dominated the entire catches in the peak season with a relative abundance of 87.35%.
Brachydeuterus auritus, which hitherto in the lean season constituted 19.25% relative abundance and the third dominating species, was not observed at all in the peak season. This was the same for species such as
Sardinella maderensis,
Scyacium micrurum,
Ethmalosa fimbriata and
Sphyraena sphyraena, which were observed in the lean season but not observed in the peak season.
Species that were not available in the lean season but observed in the peak season include Sepia officinalis,
Ephippion guttifer,
Priacanthus arenatus and
Dactylopterus volitans, with relative abundances of 0.29%, 0.33%, 0.18% and 0.03% respectively (
Table 6). The differences between the relative abundances of species in the two seasons in the semi-industrial fishery were however found to be not significant (Kruskal-Wallis H test, df =1, P > 0.05).
The dominant taxonomic family observed in the artisanal fishery was
Carangidae, with a relative abundance of 44.39% (
Table 3).
|
.jpg)
Table 4 Species composition and relative abundance of species and families found in the semi-industrial fishery during the lean and peak fishing seasons of the year 2013
|
Taxonomic families which had two or more species recorded together with the dominant family represented 61.95% relative abundance, while the other taxonomic families such as Pomadasydae, Sepiidae, Polynemidae, Portunidae, made up 38.05% relative abundance.
Carangidae was also the dominant family in the semi-industrial fishery, with a relative abundance of 48.78%.
Carangidae,
Clupeidae and
Scombridae made up 95.27% total relative abundance in the semi-industrial fishery (
Table 4). Others, comprising
Bothidae,
Dactylopteridae,
Pomadasydae,
Priacanthidae,
Sciaenidae,
Sepiidae,
Sphyraenidae and
Tetraodontidae made up 4.73% total relative abundance.
|
.jpg)
Table 5 Abundance and relative abundance of crustaceans and molluscs in the artisanal fishery
|
3.2.1 Shellfish abundance
Two crustacean species;
Callinectes sapidus and
Penaeus notialis, from taxonomic families Portunidae and Penaeidae respectively and one mollusc specie Sepia officinalis from Sepiidae were identified in the artisanal fishery. Sepia officinalis was also identified in the peak season of the semi-industrial fishery but there was none in the lean season. No crustaceans were identified either in the lean or peak seasons of the semi-industrial fishery. During the lean season in the artisanal fishery, the crustacean and molluscan abundance was generally low as compared to that from the peak season (
Table 5).
Peneaus notialis was not observed at all during the lean season, but was present during the peak season in large quantities. In total, the shellfish species from the artisanal fishery accounted for 0.39% of total catch in the lean season and 6.90% in the peak season, whereas that from the semi-industrial fishery accounted for only 0.29% of the total catch during the peak season.
3.2.2 Diversity indices
Number of fish species observed ranged from 12 in the peak season of the semi-industrial fishery to 28 in the peak season of the artisanal fishery (
Table 6). Thus, the peak season of the semi-industrial fishery was the least species rich with only 12 species, while the peak season of the artisanal fishery with 28 different species had the highest number of species. In the artisanal fishery, ecological diversity indices measured (Margalef, Pielou, Shannon-Weiner and Simpson indices) were all higher in the peak season as compared to the lean season.
However in the semi-industrial industry, although abundance (average number of individuals) was higher in the peak season than the lean season, all diversity indices measured were lower in the peak season. The combined diversity scores indicate that the peak season of the artisanal fishery was the most diverse (15) and the peak season of the semi-industrial fishery the least diverse (4) season and fishery. The scores also revealed that the total number of species identified did not necessarily relate to species diversity, as the lean season of the artisanal fishery had a higher number of species but lower diversity as compared to the lean season of the semi-industrial fishery (
Table 6).
|
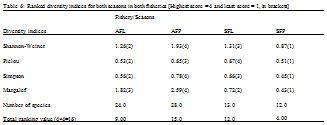
Table 6 Ranked diversity indices for both seasons in both fisheries [Highest score = 4 and least score = 1, in brackets]
|
Legend
AFL = Artisanal fishery lean season
AFP = Artisanal fishery peak season
SFL = Semi-industrial fishery lean season
SFP = Semi-industrial fishery peak season
3.3 Significant physico-chemical parameters affecting biological variations
Out of the eighteen parameters measured, six parameters significantly (RELATE, r = 0.955, p < 0.05) explained best the variations observed in the biological data, using the BVSTEP method in PRIMER 6 to relate fish abundance and environmental data. These were total alkalinity, pH, carbonate ion concentration, nitrates, phosphates and the Revelle factor.
The Principal Components Analysis (PCA) performed with these parameters for species abundance for both sites and seasons yielded two principal components (eigenvalues > 1;
Table 7) with a cumulative variance accounting for 79.8% of the total variation. Scores on PC1 were positively correlated with Revelle factor and nitrates but negatively correlated with pH and Carbonate ion concentration (
Table 2). High scores on PC1 were thus associated with increasing Revelle factor and nitrates and decreasing pH and carbonate ion concentration. Both seasons sampled in the artisanal fishery loaded negatively on PC1 (
Table 8), and thus inversely correlated with the scores on PC1. Abundance and diversity in the artisanal fishery increases with decreasing pH and carbonate ion concentration and decreases with increasing Revelle factor and nitrates. Both seasons in the semi-industrial fishery except the third month of the lean season which was not significant (P < 0.4) loaded positively on PC1 (
Table 8). Thus with the exception of month 3 sampled in the lean season in the semi-industrial fishery, abundances of species observed in all other seasons of the two fisheries probably increased with increasing nitrate levels and an increasing Revelle factor, while they decreased with decreasing pH and carbonate ion concentration. Scores on PC2 were positively correlated with nitrates and negatively correlated with total alkalinity. Thus scores on PC2 increased with increasing nitrates and decreasing total alkalinity.
|
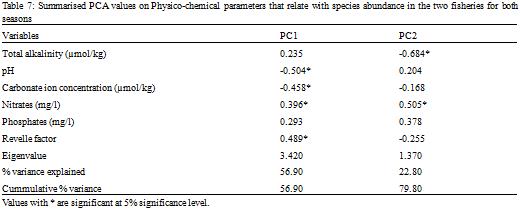
Table 7 Summarised PCA values on Physico-chemical parameters that relate with species abundance in the two fisheries for both seasons
|
|
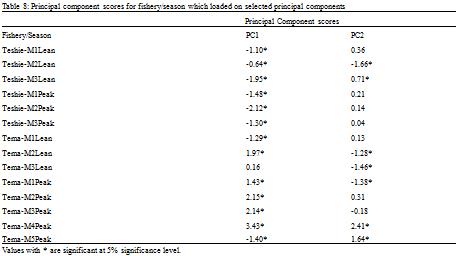
Table 8 Principal component scores for fishery/season which loaded on selected principal components
|
Three months in the lean season in the semi-industrial fishery loaded negatively on PC2 and two months in the peak season loaded positively on PC2 (
Table 3). Thus, abundance and diversity observed in the lean season of the semi-industrial fishery reduced with increasing nitrate levels and increased with decreasing total alkalinity whereas abundances observed in the peak season increased with increasing nitrate levels and decreased with decreasing total alkalinity.
|
.png)
Figure 6 PCA showing relationship between fishery and seasons sampled and the six principal variables
|
3.4 Relationship between environmental variables and species abundance
A Canonical Correspondence Analysis further explained the relationship between the six identified principal variables and fish species that occurred in the seasons and fisheries. For the lean season of the artisanal fishery, the first two axes cumulatively explained 100% of the variation found in species abundance as a result of the selected environmental variables, with axis 1 alone accounting for 91.3% of the variation. The first ordination axis reflected species with a gradient related to pH, nitrates and phosphates on the positive end of the axis and Revelle factor, total alkalinity and carbonate ion concentration on the negative end. The second axis had pH and nitrates on the positive end and phosphates, Revelle factor, total alkalinity and carbonate ion concentration on the negative end (
Figure 7).
|
.png)
Figure 7 CCA biplot showing relationship between dominant fish species identified in the lean season of the artisanal fishery
|
The species
Sphyraena sphyraena related well with Revelle factor and total alkalinity but showed a negative relation with pH and nitrates (
Figure 7). The other dominant species identified in this fishery did not seem to be influenced by any of the variables. For the rare fish species (species with relative abundance lesser than 1%) identified in this fishery during the lean season,
Ephippion guttiffer was identified to relate well with pH (
Figure 8).
|
.png)
Figure 8 CCA biplot showing relationship between rare fish species identified in the lean season of the artisanal fishery
|
For the peak season of the artisanal fishery, the first two axes cumulatively explained 100% of the variation found in species abundance as a result of the selected environmental variables. The first ordination axis reflected species with a gradient related to Revelle factor, nitrates and phosphates on the positive end of the axis and pH, total alkalinity and carbonate ion concentration on the negative end. The second axis had pH, total alkalinity, carbonate ion concentration and nitrates on the positive end and phosphates and Revelle factor on the negative end (
Figure 9). The species
Chloroscombrus chrysusrus related well with pH and carbonate ion concentration but showed a negative relation with nitrates, Revelle factor and phosphates (
Figure 9).
Drepane africana however related well with Revelle factor and phosphates but showed negative relation with pH and carbonate ion concentration. For the rare fish species (species with relative abundance lesser than 1%) identified in this fishery during the lean season, Sepia officinalis was identified to relate well with pH (
Figure 10).
|
.png)
Figure 9 CCA biplot showing relationship between dominant fish species identified in the peak season of the artisanal fishery
|
|
.png)
Figure 10 CCA biplot showing relationship between rare fish species identified in the peak season of the artisanal fishery
|
The first two ordination axes from the CCA cumulatively accounted for 100% of the variations of the species abundance from the environmental parameters in the lean season of the semi-industrial fishery. pH was found to be positive on the first axis and phosphates, nitrates, Revelle factor, total alkalinity and carbonate ion concentration on the negative end of the axis. On the second axis, total alkalinity, nitrates and phosphates were on the positive end while Revelle factor, pH and carbonate ion concentration were on the negative end.
Auxis thazard related well with both total alkalinity and nitrates, while
Selar crumenophthalmus related well with pH and carbonate ion concentration.
Sardinella maderensis also related well with the Revelle factor (
Figure 11).
|
.png)
Figure 11 CCA biplot showing relationship between dominant fish species identified in the lean season of the semi-industrial fishery
|
For the peak season of the semi-industrial fishery however, the first two ordination axes explained 97.6% of observed variations. Nitrates, phosphates, pH and carbonate ion concentration were found on the positive end of the first axis while Revelle factor and total alkalinity were found on the negative end. Revelle factor, total alkalinity and carbonate ion concentration were found on the negative end of the second axis while nitrates, phosphates and pH were found on the positive end. The species
Sardinella aurita related well with pH, while
Decapterus punctatus related well with Revelle factor and total alkalinity (
Figure 12).
Selar crumenophthalmus, a rare species per abundance, was found to relate well with pH, while Sepia officinalis was partially related to carbonate ion concentration and the Revelle factor (
Figure 13).
|
.png)
Figure 12 CCA biplot showing relationship between dominant fish species identified in the peak season of the semi-industrial fishery
|
|
.png)
Figure 13 CCA biplot showing relationship between rare fish species identified in the peak season of the semi-industrial fishery
|
3.5 Ichthyoplankton abundance
Larvae of fish found were mainly species of
Sardinella in both seasons. In the peak season, a large number of
decapoda larvae, primarily of the family Peneaidae and Portunidae were observed, as well as larvae of the species
Scyacium micrurum. A higher abundance was observed during the peak season as compared to the lean season (
Figure 14). However these abundances were found to be not significant (Kruskal-Wallis H test, df = 1, P > 0.05).
|
.png)
Figure 14 Seasonal means of total ichthyoplankton abundance in the artisanal fishery (error bars represent standard deviation)
Note: The orange bar is peak season and blue bar is lean season
|
A canonical correspondence analysis (CCA) of the abundance of these identified species with the principal environmental factors identified to influence biological variations revealed that the first two ordination axes accounted for 100% of variations in the larvae abundance. pH, phosphate and Revelle factor were found to be on the positive end of the first axes while carbonate ion concentration, total alkalinity and nitrates were found on the negative end. On the second axis, pH, carbonate ion concentration, total alkalinity and nitrates were found on the positive end and Revelle factor and phosphates on the negative end. Decapod species, consisting of species from the family Penaeidae and family Portunidae were found to relate well with Revelle factor (
Figure 15).
|
.png)
Figure 15 CCA biplot of identified fish larvae in the peak season of the artisanal fishery
|
4 Discussion
Two ocean acidification parameters (pH and carbonate ion concentration), two seawater carbonate chemistry parameters (total alkalinity and Revelle factor) and two nutrients (nitrates and phosphates) were identified by the Principal Components Analysis to significantly (RELATE, r = 0.955, p < 0.05) account for variances observed in the sampled sites. The influence of these parameters, especially those of the seawater carbonate chemistry and ocean acidification indicators tend to paint a trend of the possible occurrence of ocean acidification impacting abundance and diversity of fish species in the two sampled fisheries.
Diversity indices measured for the two fisheries indicate a higher species richness and diversity in the artisanal fishery over the semi-industrial fishery (
Table 8), with the artisanal fishery exploiting a greater multi-species diverse assemblage. The artisanal fishery is operated at the nearshore environment, an environment usually used as breeding and nursery grounds for many species (
Islam and Haque, 2004), thus, the diverse assemblage. Of the 33 fish species identified in the artisanal fishery, representing catches from the beach seine fishery, 28 species from 16 taxonomical families were identified by Aggrey-Fynn and Sackey-Mensah (2012) over a 17-month sampling period on the central coast of Ghana. Nunoo (2003) also identified 23 species from 11 taxonomic families over a 24-month sampling period on the eastern coast of Ghana.
Major species identified which accounted for about 85% of total catches such as
Brachydeuterus auritus,
Selene dorsalis,
Chloroscombrus chrysurus, are in agreement with major species identified by Nunoo (2003) and Aggrey-Fynn and Sackey-Mensah (2012) in the artisanal fishery. However the species
Sardinella aurita, which is usually known to be high in abundance especially during peak fishing seasons on the coasts of Ghana as a result of seasonal upwelling (
Koranteng, 1995;
Minta, 2003), had a lower relative abundance of 0.35% as compared to 13.1% found by Aggrey-Fynn and Sackey-Mensah (2012). Data from FAO(http://www.fao.org/figis/servlet/SQServletfile=/work/FIGIS/prod/webapps/figis/temp/hqp_1266072729134742
20.xml&outtype=html) show a general downwards trend of Sardinella aurita catches over the past ten years. This could be a contributory factor to observed lower catches of S. aurita in the artisanal fishery.
Relations of fish species and indicators and parameters of ocean acidification from the CCA biplots revealed impacts of ocean acidification on abundance of species such as
Sardinella aurita,
Sardinella maderensis,
Selar crumenophthalmus,
Chloroscombrus chrysurus,
Auxis thazard,
Ephippion guttifer and
Sphyraena sphyraena.
Sphyraena sphyraena was positively related with total alkalinity in the lean season of the artisanal fishery (
Figure 9), indicating that as total alkalinity increased, abundance of this species increased and vice versa. Total alkalinity is a seawater carbonate chemistry parameter and as such a determinant of ocean acidification, thus, ocean acidification could be said to result in decreasing abundance of
Sphyraena sphyraena, a very important commercial species in the artisanal fishery. With time, this could likely lead to a decreased diversity for this fishery.
In the peak season of the semi-industrial fishery,
Sardinella aurita positively related to pH and carbonate ion concentration (
Figure 12). The decreasing trend in pH and carbonate ion concentration observed in the semi-industrial fishery (
Figure 5) thus relates to a decrease in abundance of the species
Sardinella aurita, another very important commercial species for both fisheries. Odulate et al. (2014) also observed the abundances of
Sardinella aurita to be influenced by pH levels in marine coastal waters of the Gulf of Guinea, Southwest Nigeria.
Selar crumenophthalmus,
Chloroscombrus chrysurus and
Ephippion guttifer were also identified to relate positively with pH in
Figures 13,
9, and
8 respectively. These findings underscore the evidence that ocean acidification as a result of decreased pH levels would impact fish species, as reported by authors such as Fabry et al. (2008); Doney et al. (2009) and Munday et al. (2009).
The relative abundance of shellfish was higher in the peak season as compared to the lean season in the artisanal fishery. Change in abundance could probably be influenced by increased pH and carbonate ion concentration as shown from the canonical correspondence analysis. Sepia officinalis was found to relate positively with pH from the CCA biplot (
Figure 10), implying a decrease in abundance of the species as pH decreased. Thus ocean acidification as a result of decreased pH would impact the abundance of S. officinalis and thus the diversity of the fishery. A decrease in abundance would result in a loss of the species over time and the fisheries that depend on them, thus reducing diversity and vice versa. Gutowska and Melzner (2009) also found linear relationships between mass of S. officinalis and pH, confirming that decreased concentrations of pH could result in the observed decreased abundance of the species. Also, since S. officinalis is a mollusc which makes use of calcium carbonate in the formation of its internal shell, decreasing carbonate ion concentration in its environment as evidenced by the results could also account for decreased abundance. In the semi-industrial fishery, abundance of S. officinalis, a high value export species from Ghana, was again influenced by carbonate ion concentration.
There was no clear evidence that ocean acidification was affecting the relative abundances and diversities of the shellfish species
Callinectes sapidus and
Penaeus notialis identified in the artisanal fishery, since these species did not relate with any of the ocean acidification indicators or the seawater carbonate chemistry parameters. Since these are calcifying organisms, the findings are in contrast to reports from Vezina and Hoegh-Guldberg (2008); Doney et al. (2009); Munday et al. (2009) and Barnard and Grekin (2010) which indicate that ocean acidification would impact negatively on calcifying organisms. However, Ries et al. (2009) has shown that this could occur, as their work on laboratory simulations revealed that marine calcifiers such as crustaceans may exhibit varied responses and further observed that
C. sapidus did not exhibit any significant effects to ocean acidification. Although results for calcite and aragonite saturation states for the artisanal fishery show a decreasing trend with respect to the seasonal means (4.43 ~ 2.60 for aragonite saturation; 6.67 ~ 3.99 for calcite saturation;
Table 1), none of the saturation states is yet below the value of 1, the value at which under saturation takes place according to Royal Society (2005). This could perhaps explain why the crustacean species were neither influenced by any of the seawater carbonate chemistry parameters nor ocean acidification parameters from the CCA. Thus ocean acidification could be a contributing factor to the observed abundances of molluscs but inconclusive for observed abundances of crustaceans in the artisanal fishery.
Ichthyoplankton has been identified to be more susceptible to ocean acidification and other environmental factors than adult fish (
Sumaila et al., 2011). In this study, Ichthyoplankton was found to be generally higher in the peak season than the lean season (
Figure 14). Sardinella larvae observed confirm the abundance of
Sardinella sp. in coastal waters of Ghana usually linked with upwelling periods as documented by Koranteng, 1995; Minta, 2003 and Djagoua et al., 2011. None of the ocean acidification indicators and parameters was found to relate with abundance of
Sardinella larvae from the CCA biplot (
Figure 15), however, it is inconclusive to say that ocean acidification does not impact
Sardinella larvae, and thus requires further investigation in the future.
Decapod larvae, mainly of families Peneaidae and Portunidae were however found to relate well with carbonate ion concentration, pH and the Revelle factor from the CCA biplot (
Figure 15). Species of these families which include
Peneaus notialis and
Callinectes sapidus identified in the artisanal fishery can therefore be said to susceptible to ocean acidification, and could thus be a factor to low abundances of adult
Peneaus notialis and
Calinectes sapidus species observed in the artisanal fishery (
Table 5). The result is in support of the report from Vezina and Hoegh-Guldberg, 2008 and Doney et al., 2009 which anticipates that larvae of calcifying organisms are highly susceptible to ocean acidification.
5 Conclusions
This study has shown that ocean acidification is possibly occurring in Ghanaian waters, as evidenced by decreasing pH, decreasing carbonate ion concentration, decreasing calcite and aragonite saturation states, decreasing total alkalinity and increasing Revelle factor. Secondly, evidence has been provided that ocean acidification has possible impacts on the abundance and diversity of fish species landed by the artisanal and semi-industrial fisheries in Ghana. Finally, although it is not clear whether ocean acidification parameters are impacting on abundance and diversity of adult species of crustaceans, there is evidence that this could occur with their larvae.
In the light of observed ocean acidification and its impacts, it is recommended that efforts should be sustained to gather long term data on ocean acidification and fish diversity in Ghanaian coastal waters. The effort should include instituting an ocean acidification observance programme to effectively monitor changes in seawater carbonate chemistry and ocean acidification parameters. These datasets could be used to develop a bioclimatic model to further predict future impacts of ocean acidification on fish diversity in Ghana and for the Guinea Current Large Marine Ecosystem. It would be useful to undertake tissue analyses of fish species to ascertain the uptake of carbon by fish species found to be impacted by ocean acidification. Finally, further studies on impacts of ocean acidification on ichthyoplankton should be undertaken to inform the dynamics of abundance of fish stocks.
Acknowledgements
We are grateful to the International Atomic Energy Agency for funding this project, under the Co-ordinated Research Project (CRP) number K41012 and Contract number 17539. We also thank Messrs. J. Akomeah, E. Klubi, M. Boateng and K. Enyan, all of the Department of Marine and Fisheries Sciences, University of Ghana, for their assistance on the field and in the laboratory.
Aggrey-Fynn J., and Sackey-Mensah R., 2012, Species Diversity and Relative Abundance of Fisheries Resources Found in Beach Seine along the central coast of Ghana. West African Journal of Applied Ecology 20: 1–9
Akyempon S., Bannerman P., Amador K., and Nkrumah B., 2014, Ghana Canoe Frame Survey 2013. Fisheries Scientific Survey Division, Ministry of Fisheries and Aquaculture Development. Information Report No 35. 72 pp. Tema, Ghana
APHA 1998, Standard Method for the Examination of Water and Wastewater (20th edn.) Washington DC., USA
Armstrong C.W., Hole S., Navrud S., and Seifert I., 2012, The Economics of Ocean Acidification – a scoping study. 57 pp
Asiedu B., and Nunoo F.K.E., 2013, Alternative livelihoods: A tool for sustainable fisheries management in Ghana. International Journal of Fisheries and Aquatic Sciences 2 (2): 21-28
Barnard N., and Grekin J., 2010, Ocean Acidification. Biodiversity and Climate Change, Issue Paper No. 7. Available online at http://www.unep.org/delc/IssuePapers (Accessed on 20th December, 2013)
Bates N.R., Best M.H.P., Neely K., Garley R., Dickson A.G., and Johnson R.J., 2012, Detecting anthropogenic carbon dioxide uptake and ocean acidification in the North Atlantic Ocean. Biogeosciences 9: 2509-2522
Clarke K. R., and Warwick R. M., 2001, Change in marine communities: an approach to statistical analysis and interpretation (2nd edn.). PRIMER-E: Plymouth. 176 pp
Cooley S.R., and Doney S.C., 2009, Anticipating ocean acidification’s economic consequences for commercial fisheries. Environmental Research Letters 4: 1-8
Djagoua E.V., Kassi J.B., Mobio B. Kouadio J.M., Dro C., Affian K., and Saley B., 2011, Ivorian and Ghanaian upwelling comparison: intensity and impact on phytoplankton biomass. American Journal of Scientific and Industrial Research 2 (5): 740-747
Doney S.C., Fabry V.J., Feely R.A., and Kleypas J.A., 2009, Ocean Acidification: The other CO2 Problem. Annual Reviews of Marine Science 1: 169-192
PMid: 21141034
Dupont S., and Portner H-O., 2013, A snapshot of ocean acidification research. Marine Biology 160: 1765 – 1771
Fabry V.J., Seibel B.A., Feely R.A., and Orr J.C., 2008, Impacts of ocean acidification on marine fauna and ecosystem processes. ICES Journal of Marine Science 65: 414-432
Fischer W., Bianchi G., and Scott W.B. (eds.) 1981, FAO species identification sheets for fishery purposes. Eastern Central Atlantic; fishing areas 34, 47 (in part). Canada Funds-in-Trust. Ottawa, Department of Fisheries and Oceans Canada, by arrangement with the Food and Agriculture Organization of the United Nations, vols. 1-7
Gutowska M.A., and Melzner F., 2009, Seawater carbonate chemistry and biological parameters of Sepia officinalis during experiments. Available online at
http://doi.pangaea.de (Accessed 19th June, 2014)
Hall-Spencer J.M., Rodolfo-Metalpa R., Martin S., Ransome E., Fine M., Turner S.M., Rowley S.J., Tedesco D., and Buia M-C., 2008, Volcanic carbon dioxide vents show ecosystem effects of ocean acidification. Nature 454: 96-99
PMid: 18536730
Hilmi N., Allemand D., Dupont S., Safa A., Haraldsson G., Reynaud S., Hall-Spencer J.M., Fine M., Turley C., Jeffree R., Orr J., Munday P.L., and Cooley S.R., 2012. Towards improved socioeconomic assessments of ocean acidification impacts. Marine Biology 160: 1773-1787
PMid: 24391285 PMCid:PMC3873077
International Panel on Climate Change (IPCC) 2001, Climate Change 2001: The Scientific Basis. Contribution of Working Group I to the Third Assessment Report of the Intergovernmental Panel on Climate Change [Houghton J.T., Ding Y., Griggs D.J., Noguer M., van der Linden P.J., Dai X., Maskell K., and Johnson C.A., (eds.)]. Cambridge University Press, Cambridge, United Kingdom and New York, NY, USA, 881pp
International Panel on Climate Change (IPCC) 2011, Workshop Report of the Intergovernmental Panel on Climate Change Workshop on Impacts of Ocean Acidification on Marine Biology and Ecosystems [Field C.B., Barros V., Stocker T.F., Qin D., Mach K.J., Plattner G.-K., Mastrandrea M.D., Tignor M., and Ebi K.L., (eds.)]. IPCC Working Group II Technical Support Unit, Carnegie Institution, Stanford, California, United States of America, 164 pp
Islam M., and Haque M., 2004, The mangrove-based coastal and nearshore fisheries of Bangladesh: ecology, exploitation and management. Reviews in Fish Biology and Fisheries 14: 153-180
Koranteng K.A., 1995, The Ghanaian fishery for sardinellas. In: Dynamics and Use of Sardinella Resources from Upwelling off Ghana and Ivory Coast, pp. 290–299. Ed. by Bard F. X., and Koranteng K.A. ORSTOM Edition, Paris
Kroeker K.J., Kordas R.L., Crim R.N., and Singh G.G., 2010, Meta-analysis reveals negative yet variable effects of ocean acidification on marine organisms. Ecology Letters 13: 1419-1434
PMid: 20958904
Kwei E.A., and Ofori-Adu D.W., 2005, Fishes in the Coastal waters of Ghana. Ronna publishers, Tema-Ghana. ISBN: 9988791151. 108 pp
Lam V.W.Y., Cheung W.W.L., Swartz W., and Sumaila, U.R., 2012. Climate change impacts on fisheries in West Africa: implications for Economic, Food and Nutritional Security. African Journal of Marine Science 34 (1): 103-117
Ministry of Fisheries (MOFI) 2008, National Fisheries and Aquaculture Policy. 39 pp
Minta S.O., 2003, An assessment of the vulnerability of Ghana’s coastal artisanal fishery to climate change. MSc. Thesis. University of Tromso. 83 pp
Mohammed E.Y., and Uraguchi Z.B., 2013, Impacts of Climate Change on Fisheries: Implications for food security in sub-Saharan Africa. In book: Global Food Security: Emerging Issues and Economic Implications, Chapter 4, Publisher: Nova Publishers, Editors: Munir Hanjra A., pp.113-136
Munday P.L., Donelson J.M., Dixson D.L., and Endo G.G.K., 2009, Effects of ocean acidification on the early life history of a tropical marine fish. Proceedings of the Royal Society B: Biological Sciences 276 (1671): 3275-3283
PMid: 19556256 PMCid:PMC2817176
Nielsen L.A., and Johnson D.L. (Eds.), 1985, Fisheries Techniques. (2nd edn.). American Fisheries Society, Bethesda, Maryland. 468 pp
Nunoo F.K.E., 2003, Biotic, abiotic and anthropogenic controls of fish assemblages caught in beach seines at Sakumono, Ghana and their management implications. Ph.D. Thesis, University of Ghana, Legon, Ghana. 153 pp
Odulate D.O., Akegbejo-Samsons Y., and Omoniyi I.T., 2014, Multivariate analysis of fish species and environmental factors in marine coastal waters of the Gulf of Guinea, Southwest Nigeria. Croatian Journal of Fisheries 72: 55-62
Perry R.I., Harding G.C., Loder J.W., Tremblay M.J., Sinclair M.M., and Drinkwater K.F., 1993, Zooplankton distributions at the Georges Bank frontal system: retention or dispersion? Continental Shelf Research 13 (4): 357-383
Perry R.I., 2010, Potential Impacts of Climate change on marine wild capture fisheries: an update. Journal of Agricultural Science 149: 63-75
Portner H-O., Langenbuch M., and Reipschläger A., 2004, Biological impact of elevated ocean CO2 concentrations: lessons from animal physiology and Earth history. Journal of Oceanography 60: 705–718
Ries J.B., Cohen A.L., and McCorkle D.C., 2009, Marine calcifiers exhibit mixed responses to CO2-induced ocean acidification. Geological society of America 37 (12): 1131-1134
Robbins L.L., Hansen M.E., Kleypas J.A., and Meylan S.C., 2010, CO2calc – A user-friendly seawater carbon calculator for Windows, Max OS X and iOS (iPhone), U.S. Geological Survey Open-File Report 1280: 1–17
Rogers A.D., and Laffoley D.d’A., 2011, International Earth system expert workshop on ocean stresses and impacts. Summary report. IPSO Oxford, 18 pp
Royal Society 2005, Ocean acidification due to increasing atmospheric carbon dioxide. Policy document 12/05. ISBN 0854036172. 168 pp
Schneider W., 1990, FAO Species Identification Sheets for Fishery Purposes-Field Guide to the Commercial Marine Resources of the Gulf of Guinea. Food and Agricultural Organization of the United Nations, Rome, ISBN: 9251030480, 268 pp
Shapiro S.S., and Wilk M.B., 1965, An analysis of variance test for normality (complete samples). Biometrika 52: 591–611
Sumaila R.U., Cheung W.W.L., Lam V.W.Y., Pauly D., and Herrick S., 2011, Climate change impacts on the biophysics and economics of world fisheries. Nature Climate Change 1: 449–456
Tamakloe W., 2009, State of Ghana’s Environment - Challenges of Compliance and Enforcement. Available online at www.inece.org/indicators/proceedings/ 04_ghana.pdf (Accessed 20th December, 2013)
ter Braak C.J.F., 1986, Canonical correspondence analysis: a new eigenvector technique for multivariate direct gradient analysis. Ecology 67:1167-1179
Turley C., and Gattuso J-P., 2012, Future biological and ecosystem impacts of ocean acidification and their socioeconomic-policy implications. Current Opinion in Environmental sustainability 4 (3): 278-286
Vezina A.F., and Hoegh-Guldberg O., 2008, Effects of ocean acidification on marine ecosystems. Marine Ecology Progress Series 373: 199-201

 Author
  Correspondence author
.png)
.png)
.png)
.png)
.png)
.png)
.png)
.png)
.png)
.png)
.png)
.png)
.png)
.png)
.png)


