Research Report
A Study of pH Values in the Shatt Al-Arab River (Southern Iraq) 
 Author
  Correspondence author
International Journal of Marine Science, 2016, Vol. 6, No. 29 doi: 10.5376/ijms.2016.06.0029
Received: 13 Jun., 2016 Accepted: 17 Aug., 2016 Published: 29 Aug., 2016
Al-Asadi S.A.A.R., 2016, A Study of pH Values in the Shatt Al-Arab River (Southern Iraq), International Journal of Marine Science, 6(29): 1-8 (doi: 10.5376/IJMS.2016.06.0029)
This study attempts to investigate the factors affecting pH values in the Shatt Al-Arab River with emphasis on their Spatial and temporal variations. The pH values were measured in situ by using WTW Multi-meter, for three important stations (along the region extended from Basrah city to Al-Fao town) during 2013.
The average spatial values varied from 7.71 at Basrah to 7.96 at Abul Khaseeb to 8.09 at Fao. While temporally the result showed that the pH values varied from 7.38 at spring season to 8.24 at summer season. These variations of pH values are due to spatial and temporal variations in indoor environmental conditions. The temporal variation of pH values observed during the period 1977-2013 showed that the Shatt Al- Arab water has a good buffering for changing pH values. Also, the daily fluctuations of pH values in the river was small, where pH change varied from 6.96 to 7.52
1 Introduction
The pH is one of the most important environmental factors limiting the distribution of species in aquatic habitats. And it affects most chemical and biological processes in water (Rukeh & Agbozu, 2013). Therefore a pH is an important parameter that determines the suitability of water for different purposes.
Water quality is affected by the pH value because pH often determines which ionic species will be present. Theoretically pure water, such as distilled has a pH neutral 7.0 (ASCC, 2003), the water which has a little high pH refers to increasing the concentration of bicarbonates (HCO3), where water has a little low pH refers to increasing the concentration of carbonates (CO3), while the pH values extremes (more than 9 and less than 5) refer to water pollution (Lutz & Francois, 2007). The pH values between 6.5 and 8.5 usually indicate good water quality and this range is typical of most major drainage basins of the world (UNEP, 2006). The taste of water is influenced by pH, at low pH water may taste sour, while at high pH water tastes bitter or soapy (SAWQG, 1996). Also a pH of river water is an important control of trace metal solubility, because acidic conditions contribute to trace-metal mobilization and transport (Broshears et al., 1996). Therefore the understanding of the complex sources of spatial distribution of pH values can be used to indicate areas that might benefit most from mine-site remediation (Wright et al., 2007).
The pH of water affects the normal physiological functions of aquatic organisms, including the exchange of ions with the water and respiration (RBI, 2004). Hence, most freshwater aquatic organisms adapted to live in pH between 5.0 and 9.0 (NERR, 1997; RBI, 2004). For example fishes may become stressed and die if the pH drops below 5 or rises above 10 (Wurts & Durborow, 1992), with optimal conditions for most aquatic organisms being 6.5 to 8.5 (EPA, 2001).
Studies show that the pH impacts the human overall health, including energy, digestion and skin as well as risk for serious diseases, such as cancer, osteoporosis and even obesity (FSC, 1996). In addition, solutions of pH 10-12.5 have been reported to cause hair fibers to swell and gastrointestinal irritation may also occur. Below pH 4, redness and irritation of the eyes (WHO, 2003).
Most studies of pH were part of chemical parameters such as Al- Aubaidy and Al- Hello (1996), and Awad et al. (2004) and Hassan (2013), or pH effects on aquatic life, such as Al- Mousawi et al. (1990) and Ajeel and Abbas (2012). Therefore, the present work is an attempt to study the pH in the Shatt Al-Arab River. The main objectives of this study are to investigate the factors affecting pH values and its Spatial and temporal variations.
2 Description of the Study Area
The Shatt Al-Arab River created from confluence of Tigris and Euphrates Rivers at Qurna city about 70 Km north of Basra Governorate, and extends downstream to the Arabian Gulf a distance of 204 km (Figure 1). The river has a width range between 330 m in Qurna to 1250 m at the estuary and a depth varies from 8.5- 24 m between Qurna to Garmat Ali River and from 24- 11 m between Garmat Ali River to the estuary (Al-Mahdai & Al-Asadi, 2007). There are three main tributaries disembogue in the Shatt Al-Arab, these are Al-Swaib River about 5 km south of Qurna City, Garmat Ali River about 2 km north of Basra City, and the Karun River about 35 km south of Basrah city. Shatt Al-Arab discharge decreased from 724 m3/s during 1994-1995 to 44 m³/s during 2010-2011 (Al-Asadi et al., 2015), due to the construction of dams on the upper drainage basin and the tributaries of Shatt Al-Arab are closed except the Tigris River, in addition to low rainfall, increases in evaporation rate. The velocity of water current varied between 0.21- 0.27 m/s on the flood and 0.31- 0.39 m/s on the ebb at Basrah city, up at Fao city between 0.45-0.57 m/s and 0.54- 0.66 m/s on the flood and ebb respectively (Al-Asadi, 2012). The hydrological regime of the Shatt al-Arab River is affected by several factors, especially the discharge of Tigris River and the tides from the Arabian Gulf.
3 Methodology
Seasonal water samples were collected from three important stations which have been under different conditions (Table 1 and Figure 1). The samples were selected along the Shatt Al-Arab River from January to November during 2013. Water samples were taken from the subsurface in the middle of the river for each station, in order to investigate pH values trends. In addition, eight daily water samples were collected from Basrah station during May for physical parameters such as water temperatures and TDS as well as pH. In this study, pH values were measured in situ by WTW Multi-meter model 4430. It should be noted that pH values were measured by portable tools.
|
Table 1 Sampling locations and coordinates of sampling stations at Shatt Al-Arab River |
.jpg)
4 Results and Discussion
4.1 Factors effecting pH
The explanation of the pH concept is important to investigate the factors affecting pH.
A water molecule consists of two hydrogen atoms bonded to a single oxygen atom (H2O). A small number of water molecules dissociate into separate: hydrogen (H+) and hydroxyl (OH-) ions by ionization process. If the hydrogen ions are greater than the hydroxyl ions water is acidic while the hydroxyl ions dominate, then the water is basic (also called alkaline) (UNEP, 2006).
Quite literally pH is the power of hydrogen (power from German potenz) in the water (Roberge, 2008). The pH of a water is a measure of its acidity, and it is known as the acidity of water which is given by the hydrogen ion. Therefore the pH is defined as the negative logarithm of the hydrogen ion concentration in water, given by the equation that (Hach Company, 2010; Davie, 2008):
pH = -log10 [H+] (1)
Or pH= log〖1/[H⁺] 〗
Where [H+] is the hydrogen ion concentration in mol/L.
|
Figure 1 Map of Shatt Al-Arab River showing the sampling stations |
.png)
.png)
The pH scale is logarithmic which means that, when the hydrogen ion concentration increases or decreases by a factor of 10, the pH changes by one unit. pH scale ranges from 0 to 14. Water with a pH less than 7 is acidic, while at pH greater than 7 water is basic or alkaline. Water is considered neutral when the pH is approximately 7.This scale ranges product for water temperature at 25 °C.
The pH value of the Shatt Al-Arab River is affected by several factors including:
(1) Aquatic organisms
The aquatic organisms have a significant natural impact on the pH value of rivers. pH and Carbon dioxide (CO2) are conversely related. Although bacterial and algal respiration provide a source of carbon dioxide in water, however algal activity leads to decrease of concentration of carbon dioxide, due to the utilization of carbon dioxide by algae during active photosynthesis. Thus a pH value increases. For example, a pH value increasing to 10 during an algal bloom on the Potomac River estuary (NERR, 1997).
The phytoplankton were common in Shatt Al-Arab River, the majority is diatoms 75.77%, the blue-green algae came in the second place 11.42%, and followed by green algae which comprise 7.14% (Al-Mousawi et al., 1990).
(2) Climatic conditions
Photosynthesis increases during the summer season and the middle of the day where sunlight is at the maximum (Long et al., 2006). This increase is indicated by the highest pH values during the summer and lower values during the winter. Rainfall will naturally have a lower pH, due to the absorption of gases such as carbon dioxide by Rainwater and increasing the concentration of hydrogen ions in solution, therefore the pH value of rainfall was between 5 and 6 but may drop as low as 4, in air pollution nearby (Davie, 2008). The temperature affected neutral value of pH, where the neutral pH at 30 °C is 6.92, while it would be 7.48 at 0 °C (Hem, 1989).
The climate in the Shatt Al-Arab region is drought, extremely hot summer temperatures and cooler with some rain, medium humidity in the winter. Average temperatures vary from 9°C to 41°C in the winter and summer respectively. Annual rainfall rates range from 100 mm to about 200 mm (UN-ESCWA, 2013).
(3) Soil and Rocks
Some types of rock which contain carbonate and bicarbonate ions lead to variations of pH values in the waters flowing through this rock. Limestone is rich in carbonates, so that it contributes to increase pH values. Conversely, granite does not have minerals that contribute to alkalinity (Al-Imara et al., 2013). Therefore the rivers that drain limestone have a higher pH due to the dissolved bicarbonate ions. The limestone is a dominant rocks on the Shatt Al-Arab drainage basin.
(4) Human activities
A number of human activities have a harmful effect on the pH of nearby water sources. When sulfur dioxide and nitrogen oxides are emitted, through industrial operations and vehicles. Chemical pollution, from industrial operations, individuals and communities, can cause a water body to become acidic (UNEP 2010). These chemicals can enter the water through illegal discharges or after inadequate wastewater treatment. Humans contribute to lower the pH values of the water, due to contents wastewater discharges on the organic matters and heavy metals, which affect all organisms and lead to biodiversity decrease with decreasing pH values.
Shatt Al-Arab River suffered from influx of domestic sewage and agricultural irrigation water as well as the industrial wastes discharged. There are more than 600 side channels connected with Shatt Al- Arab River (Hussain et al., 1991). Most of those channels are affected heavily by organic pollution due to elevated nutrients concentrations, especially nitrates and phosphates (Eassa et al., 2015; Hassan, 2013) which contribute to relatively low pH values. For wastewater the pH ranged from 6.14 to7.86 (Basrah water directorate, 2013).
(5) Tidal phenomenon
The behavior of marine water is mainly controlled by the river runoff nearby the estuary region . When the tidal water mass in the continental shelf flows into the estuary during the flood tidal period, the sea water diffuses and mixes with the freshwater coming from upstream, which makes the water in upstream rivers salty (Xinfeng & Jiaquan, 2010). Seawater is slightly alkaline with a pH between 7.5 and 8.5, and its pH value of seawater remains relatively constant because of the buffering action of carbon dioxide in the water (Sverdrup et al., 2006). While pH values in freshwater may fluctuate dramatically, due to weaker carbonate buffering system in comparison with marine systems (Chenl & Durbin, 1994).
Shatt Al-Arab River is influenced by the seawater of Arabian Gulf, whereas the Gulf tidal wave advances along the Shatt Al- Arab River. Similar tidal regime of Arabian Gulf and Shatt Al- Arab River is mixed type, however the semi-diurnal is the dominant (Al-Badran et al., 2001). The pH values in water of Arabian Gulf ranged between 7.8 and 8.4 (Zyadah & Almoteiry, 2012) are relatively high into 8.2 as an average in Marine water (Chenl & Durbin, 1994).
4.2 Spatial and temporal variation for pH values:
The spatial distribution of pH average in the Shatt Al-Arab River varies from 7.71 at Basrah to 7.96 at AbulKhaseeb to 8.09 at Fao (Table 2 and Figure 2), due to the difference of environmental conditions between the three stations, where there is likely a large difference impacted by the urban activity, agriculture and tides respectively. Therefore, the surface water quality at the three stations is slightly Alkaline. These values demonstrated that the spatial pH changes were small about 0.38 unit.
The seasonal variation of pH values between 7.38- 7.98 at spring season and 8.00- 8.24 at summer season. The lower pH values in spring may be due to the increase of freshwater discharge in the river and rainfall events, the highest pH values during the summer season may be due to peak algal activity and low flow.
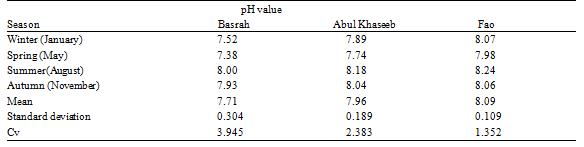
Table 2 Statistical parameters of pH values in Shatt Al- Arab River at three sites during 2013 |
.png)
Figure 2 pH values in Shatt Al- Arab River at three sites during 2013 |
The maximum pH value occurred at Fao in Summer 8.24, which happened during a period of decrease of freshwater discharge and increase the progress of tidal brackish water in addition to increase of photosynthesis. The minimum pH value occurred at Basrah in spring 7.38, which happened during a period of high flow, rainfall and relatively decrease of water temperature. These values indicated that pH changes in the seasons were moderate about 0.86 unit, and they also tend to drop toward Fao station (Figure 2). The seasonal variation of pH also confirmed by calculation of coefficient of variation statistical parameter (Cv), (Table 2). The Cv is computed as:
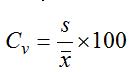 (2)
(2)
where, s is the standard deviation and is computed as:
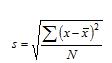 (3)
(3)
 (4)
(4)
N is the total number of values.
The highest value of Cv is observed at Basrah station 3.945 may be due to the strong variation of influenced factors, while the lowest value is recorded at Fao station 1.352 due to the dominant of the sea water.
The relationship between pH, discharge, and TDS values for the period (1977- 2013) is presented in (Table 3). It is obvious that there is no temporal relevant association between these parameters. Although, the average of values of discharge decrease significantly from 919 m3/s to 41 m3/s, and the average values of TDS increased from 1.13 g/L to 17.30 g/L, the variation in pH values is still very small. This relatedness is attributed to the same ionic structure of the river water, may be due to the balance between the sea water which contributes to the increase of pH values and sewage effluent of human activities that contributes to the decrease of pH values (Chenl & Durbin, 1994), when the discharge of freshwater in the Shatt Al-Arab River decreases the impact of sea water and sewage effluent increasing, in addition to impact increased of TDS on height internal resistance to pH change in water and height buffering capacity, where the waters with low dissolved solids, which consequently have a low buffering capacity (EPA, 2001).
.jpg)
Table 3 Variations in pH values of Shatt Al-Arab River during 1977–2013 |
The observation of daily fluctuations of pH values in Shatt Al- Arab River showed small pH change (0.56 unit), the pH value may fall to 6.96 in the early morning at 6:00 AM and increase to 7.52 in the afternoon at 3:00 PM (Table 4 and Figure 3). This daily pH change gives an indication of the limited impact of aquatic organisms on pH change which may be due to the insignificant change of daily cycles in the river flow, and large flow from 741- m3/s at flood to 882 m3/s at ebb (Al-Asadi, 2012). Also daily fluctuations in river water temperature are not clear, it ranges from 27.1 to 31.4 °C.
.jpg)
Table 4 Daily variations in pH values of Shatt Al-Arab River during May (28-29/5) at Basrah station during 2013 |
.png)
Figure 3 Daily variations in pH values of Shatt Al-Arab River during May (28-29/5) at Basrah station during 2013 |
5 Evaluation of a pH Value for Different uses
The pH values of water in the Shatt Al-Arab River in this study ranged between 7.38- 8.24, effecting water suitability for usage. A comparison with WHO, FAO standards indicates that all the station showed a pH value within the permissible limit of 6.5- 8.5 (Table 5). So, the river water of these stations are suitable for drinking due to no significant effects on health, and suitable for irrigation, livestock and poultry. The pH values are in acceptable limits 5.0- 9.0 for aquatic organisms.
.jpg)
Table 5 Water quality parameters and comparative guidelines |
6 Conclusions
1- The range in pH values was moderate in Shatt Al-Arab, about (0.86 unit). The minimum value occurred at Basrah Station on Spring (7.38), while the maximum value occurred at Fao Station on August (8.24).
2- The change in pH values resulted from spatial and temporal variations in environmental conditions such as the tidal phenomenon, human activities, aquatic organisms and climatic conditions.
3- The pH values during the study period tend to be slightly alkaline and does not fluctuate widely, which is consistent with previous studies.
4- There is no variation in pH values among the studied years during 1977 to 2013.
5- The Shatt Al- Arab water has a good buffering for changing the pH values.
6- The observance of daily fluctuations of pH values showed that small pH change 0.56 unit.
7- The pH values in the Shatt Al-Arab River show seasonal and spatial differences but for all Stations fall within the acceptable range of 6.5 to 8.5.
Acknowledgements
We would like to thank Prof. Dr. Abdul Zahra A. AL- Hello, Department of Marine Chemistry, Marine Science Center, University of Basrah, for reading the manuscript and for his critical advice. And Asst. prof. Mahdi Alasadi, chairman of the department of English, College of Education for Human Sciences, University of Basrah.
Ajeel, S.G., and Abbas M.F., 2012, Diversity of Cladocera of the Shatt Al-Arab River, Southern Iraq, Mesopotamian Journal of Marine Science, 27 (2): 126-139.
Al-Asadi, S.A.R., 2012, Tidal phenomenon and its hydrological dimensions of Shatt Al-Arab (South Iraq), the Kuwait geographic society, 386: 37 P. (In Arabic).
Al-Asadi, S.A.R., 2013, Analysis of the relationship between the discharge and salinity in Shatt Al-Arab, collage of education journal, Al-Mustansiriyah University, 4: 873-892. (In Arabic)
Al-Asadi, S.A., Abdullah S.S., and Al-Mahmood H.Kh., 2015, Estimation of minimum amount of the net discharge in the Shatt Al- Arab River (south of Iraq), Journal of Adab Al- Basrah, 2: 285-314. (In Arabic)
Al-Aubaidy, A.H., and Al-Hello A.Z., 1996, Monthly variations of the nutrients and other related factors in Shatt Al- Arab River, Basrah- Iraq. Marina Mesopotamica, 11(2):365-383.
Al-Badran, B., Al-Mahdi A.A., and Abdullah S.S., 2001, Progression of the tidal wave in the Shatt Al- Arab river, south of Iraq, Marina Mesopotamica, 16 (1): 89-100.
Al-Imara, F.J., Al-Shawi I.M., and Al-Hwaichim I.K., 2013, Ecological survey of some environmental factors and discharge of the Shatt Al-Arab estuary 1977-2012, INOC -IIUM- International Conference on" Oceanography & Sustainable Marine Production: A Challenge of Managing Marine Resources under Climate Change, ICOSMaP”, Kuantan- Malaysia, 358-267.
Al-Mahdai, A.A., and Al-Asadi S.A., 2007, Some of Geomorphological features of Shatt Al-Arab River, journal of Basrah researches, 32 (1): 88-106.
Al-Mousawi, A.H., Hadi R.A., Kassim T.I., and Al-Lami A.A., 1990, A study on the algae in the Shatt. Al- Arab estuary , Southern Iraq, Marina Mesopotamica, 5(2):305-323.
Ashland specialty Chemical company (ASCC), 2003, Relationship between pH and Alkalinity, Drew Marine Waterways, Canadian Chemical Producers' Association in Canada and of different entities in other countries, 4 P.
Awad, N.A. N., FaisalW.J., and Abdul Nabi A.S., 2004, Determination of total petroleum hydrocarbons and heavy metals in water & sediments from Shatt Al-Arab River, Marina Mesopotamica, 19 (1):19-35.
Basrah water directorate, 3013, Hamdan water treatment plant, (Un published data).
Broshears, R.E., McKnight D.M., Runkel R.L., Kimball B.A., and Bencala K.E., 1996, Reactive solute transport in an acidic stream-Experimental pH increase and simulation of controls on pH, aluminum, and iron: Environmental Science and Technology, 30: 3016-3024.
http://dx.doi.org/10.1021/es960055u
Chenl, C.Y., and Durbin E.G., 1994, Effects of pH on the growth and carbon uptake of marine phytoplankton, marine ecology progress series,109: 83-94.
Davie, T., 2008, Fundamentals of Hydrology, second edition, Rout ledge Taylor & Francis Group, London, 200 p.
Eassa, A.M., Jassim W.F., Al-Maliki J.H., Al-Saad T.R., and Mehson N.K., 2015, Assessment of eutrophication and organic pollution status of Shatt Al- Arab River by using diatom indices, Mesopotamia Environmental Journal, 1(3):44-56.
Environmental Protection Agency (EPA), 2001, parameters of water quality, Interpretation and Standards, Ireland,132 p.
Forest Stewardship Council (FSC), 1996, A balanced pH for the healthiest body- naturally, genuine health, 7 P.
Hach Company, 2010, What is pH and how is it measured?, A Technical Handbook for Industry, 29 p.
Hassan, W.F., 2013, The nitrogen and phosphate forms in water of Shatt Al-Arab River in Basra/ Iraq, Marsh Bulletin, 8 (2):182-192.
Hem, J.,1989, Study and interpretation of the chemical characteristics of natural water, third edition, USA., 263 p.
Hussain, N.A., Al-Najar H.H., Al-Saad H.T., Yousif U.H., and Al- Saboonchi A.A., 1991, Shatt Al-Arab basic scientific studies, Marine Science Centre Publ. Basra Univ., 391 p. (In Arabic).
Long, S.P., Zhu X.G., Naidu S.L., and Ort D.R., 2006, Can improvement in photosynthesis increase crop yields, Plant, Cell and Environment, 29: 315-330.
http://dx.doi.org/10.1111/j.1365-3040.2005.01493.x
Lutz, D., and Francois B., 2007, Water quality studies- red rock and saylorville reservoirs des Moines river, lowa, annual report, lowa state university, Ames, 393 p.
Ministry of Irrigation, G.E.S. D., 1979, Shatt Al-Arab Project, Feas, Rep. Draft, Studies of Salinity Problem, Part A, Text, Polservies Co., Basrah, Iraq.
Ministry of Water Resources- Iraq, 2014, (Un published data).
National Estuarine Research Reserves (NERR), 1997, Estuarine Ecology, A Water Quality Monitoring Project, Carolina, Funds for this project provided through NOAA cooperative agreement #NA470Z0402, 92 P.
Roberge, P.R., 2008, Corrosion Engineering Principles and Practice, The McGraw-Hill, UAS, 754 P.
Robertson-Bryan, Inc.(RBI), 2004, pH Requirements of Freshwater Aquatic Life, Technical Memorandum, 9766 Waterman Road, Suite L2 Elk Grove, CA 95624 (916) 714-1802,13 P.
Rukeh, R.A., and Agbozu I.E., 2013, Impact of partially treated sewage effluent on the water quality of recipient Epie Creek Niger Delta, Nigeria using Malaysian Water Quality Index (WQI), J. Appl. Sci. Environ. Manage, 17(1): 5-12.
South African Water Quality Guidelines (SAWQG), 1996, Domestic Water Use, second edition, Republic of South Africa,1: 175 p.
Sverdrup, K.A., Duxbury A.B., and Duxbury A.C., 2006, Fundamentals of Oceanography, 5th edition, Mc Graw Hill Higher Education, New York, 342 p.
United Nations Economic and Social Commission for Western Asia (UN-ESCWA), 2013, Inventory of Shared Water Resources in Western Asia, Euphrates River Basin, Beirut, 148-167.
United Nations Environment Programme (UNEP), 2010, Clearing the Waters A focus on water quality solutions, Kenya, 88 P.
United Nations Environment Programme (UNEP), 2006, Water Quality for Ecosystem and Human Health, USA, 132 P.
Winfield, G., Wright W.G., Simon W., Bove D.J., Mast M.A., and Leib K.J., 2007, Integrated Investigations of Environmental Effects of Historical Mining in the Animas River Watershed, San Juan County, Colorado, U.S. Geological Survey, Professional Paper 1651, 1096 P.
World Health Organization (WHO), 2003, pH in Drinking-water, Geneva, Ashland specialty chemical company (ASCC) 2003, Relationship between pH and Alkalinity, Canada.
Wright, W.G., Simon W., Bove D.J., Mast M.A., and LeibK.J., 2007, Distribution of pH Values and Dissolved Trace-Metal Concentrations in Streams, U.S. Geological Survey, Professional Paper 1651: 496-541.
Wurts, W.A., and Durborow R.M., 1992, Interactions of pH, Carbon Dioxide, Alkalinity and Hardness in Fish Ponds, Southern Regional Aquaculture Center Publication, United States, 464: 4 p.
Xinfeng, Z., and Jiaquan D., 2010, Affecting Factors of Salinity Intrusion in Pearl River Estuary and Sustainable Utilization of Water Resources in Pearl River Delta, Alliance for Global Sustainability Book series 18, DOI 10.1007/978-90-481-9914-3-2, Springer Science,11-17.
Zyadah, M.A., Mohsin G., and Almoteiry M.G., 2012, Evaluation of Environmental Pollution in the Arabian Gulf Coast at the Eastern Province, SA, Asian Transactions on Basic and Applied Sciences, 02(03):14- 21.


. PDF(579KB)
. FPDF(win)
. HTML
. Online fPDF
Associated material
. Readers' comments
Other articles by authors
. Safaa Al-Asadi
Related articles
. pH variation
. Shatt Al- Arab River
. Alkalinity
. Water quality
. Southern Iraq
Tools
. Email to a friend
. Post a comment