Research Article
Environmental Impact Assessment of Coastal Ecosystem in Tamil Nadu, India with Hedonic and Travel Cost Models 
 Author
  Correspondence author
International Journal of Marine Science, 2016, Vol. 6, No. 36 doi: 10.5376/ijms.2016.06.0036
Received: 13 Aug., 2016 Accepted: 30 Sep., 2016 Published: 10 Oct., 2016
Amarnath J.S.and Mouna A., 2016, Environmental Impact Assessment of Coastal Ecosystem in Tamil Nadu, India with Hedonic and Travel Cost Models, International Journal of Marine Science, 6(36): 1-8 (doi: 10.5376/ijms.2016.06.0036)
The study on positive and negative externalities of coastal ecosystem with categories of serious affected, medium affected and low affected fishermen was taken up in the Cuddalore district of Tamil Nadu. Based on the intensity of pollution, they were categorized into seriously affected, moderately affected and low affected and six villages were selected with sample size of 120. The negative externality was assessed by hedonic model. For all the categories of affected fishermen, the house value was positively influenced by the household income, water quality, distance from sea and amenities of the house. Positive externalities were studied with travel cost method for mangrove and silver beach with sample size of 40 tourists for each tourist spot. The estimated total consumer surplus for mangrove forest was Rs. 199.84 crores and for silver beach, the consumer surplus was Rs. 438.60 crores.
1 Introduction
The coastline of Tamil Nadu runs to a length of about 1076kms and constitutes about 15 per cent of the coastal length of India along Bay of Bengal. Tamil Nadu is endowed with one of the largest and richest fisheries in India. The State has 1.9 lakh squaremeter of EEZ besides 21 coral islands in the Gulf of Mannar with rich habitats of corals, coastal lagoons (Pulicat Lake and Muthupet swamp) and estuaries. Tamil Nadu ranked fourth in marine production in the country. Tamil Nadu with its 1076 km of coastline, 1.90 lakh sq.km of Exclusive Economic Zone (EEZ) and a continental shelf of about 41412 Sq km is one of the leading producers of both marine and inland fish and fish products. The marine fish potential in Tamil Nadu estimated at 7 lakh metric tonnes.
In Cuddalore district, the fishing vessels namely 975 mechanized boats, 367 country crafts (vallams) and 6549 catamarans are functioning. The fish production in Cuddalore district craft wise during 2010-11 was 16059.46 tonnes for mechanized boats and for non-mechanized motorized boats was 5333.36 tonnes. It was 3358.90 tonnes for non-mechanized non-motorized boats. Shore seine crafts yielded a fish catch of 780.02 tonnes.
The negative externalities of SIPCOT industrial pollution, shrimp farming and farm house development was valued by indirect valuation methodology of hedonic valuation model in this article. The positive externalities are associated with coastal tourism in the mangrove forest area and Silver Beach. The mangrove forest area in Cuddalore is around 1100 hectare with 51 small islands. Theses mangrove wetlands provide a variety of protective and productive services and guard especially during tsunami. Silver beach is located 2 km from downtown and it is the second longest beach on the Coromandel Coast. It is one of the longest beaches with untouched by the busy life of the city. The positive externalities of coastal tourism were valued by Travel Cost model.
2. Methodology
Sampling procedure
In Cuddalore district, many fishing villages were affected by SIPCOT industries, farm house development and shrimp farming. Among these, six fishing villages were selected purposively to study the negative externalities. Based on the intensity of pollution, they were categorized into seriously affected, medium affected and low affected. To study seriously affected fishermen, Sothikuppam and Rasapettai were selected, medium affected fishermen were selected from Periyakuppam and Sithrapettai villages and low affected fishermen were selected from Parangipettai and Samiyapettai villages. A sample of 20 fishermen in each village was selected randomly and the sample size was 120.
The affected fishermen were then categorized into serious, moderate and low affected based on the intensity of pollution and was measured by indicators of number of industries, water quality and shrimp farming. In affected area, the pharmaceutical industries were the major polluting industries which discharged the waste water and intruded into sea. All the three indicators were highest in seriously affected fishing with seven industries, 4 milliohms/cm water quality and two shrimp farms. In moderately affected fishing, the pollution was moderate with five industries, 2 milliohms/ cm water quality and one shrimp farm. Lastly, in low affected fishing, the pollution was lowest with four industries, 0.50 milliohms/ cm water quality and one shrimp farm.
2.1 Valuation of negative externality- hedonic pricing method
The hedonic pricing method may be used to estimate economic benefits or costs associated with environmental quality, including air pollution, water pollution, or noise. The method’s main strength is that it can be used to estimate values based on actual choices. Property markets are relatively efficient in responding to information, so can be good indications of value. The hedonic pricing technique is a market approach, attempting to assess the value attributed by buyers to the environmental attributes of a dwelling. It is based on hedonism, in economic language it means that the hedonic measures the value of some parameters by its effect on the pleasure of the individual to live in a given region.
The hedonic model involved decomposition of the price of land or of house into the prices of attributes This could be done by using hedonic price function, which describes the equilibrium relationship between land or house price, p, and attributes, A = (a1, a2, . . . .an). The marginal price of attribute in the market is simply the partial derivative of the hedonic price function with respect to that attribute. In selecting a land or house, buyers equate their marginal willingness to pay for each attribute to its marginal price.
Utility maximization in hedonic market should satisfy
δp/ δai δθ/ δai
where θ is the household’s bid function. The equation implied that in equilibrium, the marginal willingness to pay for an attribute could be measured by its marginal price, computed from the hedonic price function.
The hedonic model formulated for the present study was of the following
VCL = a0+ a1X1+a2X2+a3X3+a4X4+U1
where,
VCL – Value of house (in Rs. /ha)
X1 – Household income (in Rs. /yr)
X2 – Drinking water quality index (It was assessed by means of taste, soft mess and turbidity)
1-Poor; 2- Average; 3- Good
X3 – Distance of house from sea (kilometre)
X4 – House amenities variables
a. Electricity-0- No and 1-yes
b. Sanitation- 0- No and 1-yes
c. Fuel for cooking- 0- Fuel wood and 1-LPG
a0 – Regression constant; a1 to a7 – Regression coefficients and µ1 - Error term
2.2 Valuation of positive externality - travel cost model
This method is used for valuation of environmental amenities. This method determines demand for a site based on variables like consumer, income, price and socio-economic characteristics. Price is the sum of observed cost elements like entry price to site, cost of traveling to site and foregone earrings or opportunity cost of time spent. Consumer surplus associated with demand curve provides measure of value of recreational site. Travel cost models are based on an extension of the theory of consumer demand in which special attention is paid to the value of time. That time is valuable is self-evident.
In this study, TCM model was estimated using a count data model which assumes a semi-log function which has the simple and attractive property of allowing the estimation of consumer surplus per trip as the inverse of the travel cost coefficient. The demand for recreational fishing takes the semi-log form, where Vr is the expected number of trips, tc is the travel costs per trip, and Xn represent other individual characteristics (independent variables) that might affect demand for recreational fishing trips.
Vr= β0+ β1tc+ β2X2+ β3X3+ β4X4+……………..βnXn
The consumer surplus (CS) per trip is simply the inverse of the coefficient of the travel cost variable given below (Creel and Loomis 1990; Englin and Shonkwiler 1995a; Eiswerth et al. 2000; Betz et al. 2003).
CS= -1/βTc
Visit = a0+ a1X1+a2X2+a3X3+a4X4+ µ1
Y=Number of visit per year
X1-Travel cost (in Rs. /family) which included
i. Entry fee (in Rs, / family)
ii. Expenditure (in Rs. /family)
iii. Loss of pay on the day of tourism (in Rs. / family)
X2-Size of group
X3-Distance from native (meter)
X4-Annual income of tourists (in Rs)
3. Result and Discussion
3.1 Hedonic model
The hedonic model is one of the household production function models which uses the indirect valuation technique. This model involved decomposition of the price of land or of the house into the price of attributes, which could be done by using hedonic price function. The hedonic price function links the land or house price with their attributes. The marginal price for an attribute computed from the hedonic price function gives a measure of willingness to pay for that attribute. Before employing the hedonic regression, the house features of the sample households were studied and presented in Table 1.
|
Table 1 House features of the sample households |
3.1.1 House features of the sample households
It could be revealed from the Table 1 that the house size was varied with pollution intensity and it ranged from 3.26 to 4.00 between serious and low affected categories. The building quality was also ranged with pollution intensity and the pucca house establishment ranged from 87.50 in serious to 100.00 per cent in low affected category. Distance of house from sea was also increased with pollution intensity. Water quality was measured in a three point scale and it was highest for low affected fishermen with 2.47 and was lowest for serious affected fishermen with 1.47. With regard to fuel for cooking, LPG connection was highest for low affected category with cent per cent connection and was lowest in serious affected category with 87.50 per cent LPG connection. Presence of toilet was also highest in low affected category with 75.00 per cent connection and the proportion was very less in serious and medium affected categories with a proportion of 25.00 per cent and 32.50 per cent respectively. Finally, access to school and hospital was also coincided with pollution intensity and the accessibility was longer for serious and shorter for less affected.
In the present study, the influence of household income and quality parameters of house quality was studied by hedonic model for all categories of affected fishermen. The semi-logarithmic functional form (logarithm in Y) was the best functional form for all the categories of affected fishermen.
3.1.2 Model
3.1.2.1 Serious affected fishermen
The household income, water quality, distance from sea and amenities of respondents influenced the house value of serious affected fishermen with one per cent level significance. (Table 2).The house hold income had positive relationship with house value and if household income increases by thousands of rupees, the house value increased by 6 per cent. The water quality had a negative relationship with house value and it revealed that, if water quality was increased by one unit, ceteris paribus, the house value was decreased by 14per cent which indicated the pollution intensity in seriously affected category. If the distance of house from sea was increased by one metre, ceteris paribus, the house value was increased by 0.40 per cent above mean level. Amenities of house if increased by one unit, ceteris paribus, and the house value were increased by 62 per cent above the mean level.
This result of water quality having a significant effect on property values was in line with findings of Legget and Bockstale. (2000). who had shown similar results in the study of Chesapeake Bay, USA. The significant influence of oceanic view or the distance from the sea on house value was in line with findings of Pompe and Rinehart (1995) in South Carolina, USA.
|
Table 2 Hedonic model for affected fishermen |
3.1.2.2. Moderately affected fishermen
For moderately affected fishermen, the household income, water quality, distance from sea and amenities of the house influenced the house value (Table 2). The house hold income had positive relationship with house value and if it increased by thousands of rupees, ceteris paribus, increased the house value by 2.90 per cent. The water quality had a positive relationship with house value, if increased by one unit in water quality ceteris paribus, increased the house value by 25 per cent due to less pollution intensity. The distance of house from sea, if increased by one meter, ceteris paribus, increased the house value by 0.10 per cent above mean level. Amenities of the house had positive relationship to house value with 0.18 coefficient values at five per cent level significance and if increased by one unit, ceteris paribus, increased the house value by 18 per cent.
3.1.2.3 Less affected fishermen
For less affecting fishermen, the household income, water quality, distance from sea and amenities of house had influenced the house value. (Table 2).The house hold income had positive relationship with house value and if increase by thousands of rupees, ceteris paribus, increased the house value by 0.73 per cent. The water quality had a positive relationship with house value, if increase by one unit in water quality, ceteris paribus, increased the house value by 6 per cent due to less pollution intensity. If the distance from sea, increased by one kilometer, ceteris paribus, increased the house value by 0.10 per cent above mean level. Amenities of house had positive relationship to house value with 0.05 coefficient value at five per cent level significance and if it increased by one unit, ceteris paribus, increased the house value by 5 per cent.
Thus for all the categories of affected fishermen, the house value was positively influenced by the household income, water quality, distance from sea and amenities of respondents excepting in seriously affected category, the water quality had negative influence on household income due to high pollution existed in that category.
Positive externalities of coastal ecosystem
The positive externality of coastal ecosystem namely the coastal tourism was valued by travel cost model for the two tourist spots of mangrove forest and silver beach.
3.2 Travel cost model
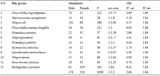
The estimates of the travel cost incurred by the tourists visiting the two tourist spots of mangrove forest and silver beach are presented in Table 3. It could be inferred from the table that the travel cost incurred by the tourists visiting mangrove forest was higher with Rs. 1562 per visit as compared to silver beach with ₹.487 per visit. The travel cost included the travel expenditure, entry cost and wage loss. Of the total travel cost, for mangrove forest, wage loss accounted for the highest proportion with 48 per cent. For silver beach, travel expenditure accounted for the highest proportion with 51.00 per cent. Entry cost was present only for mangrove forest.
|
Table 3 Travel cost of tourists for mangrove forest and silver beach |
.jpg)
|
Table 4 Semi log function for mangrove forest and silver beach |
|
Table 5 Estimation of consumer surplus |
.jpg)
3.2.1 Semi log function
Consumer Surplus per trip was estimated first by fitting semi-log function and then estimating it as the inverse of the travel cost coefficient. The estimated semi log function for mangrove forest and silver beach is presented in Table 4. It could be seen from the table that travel cost and distance from native, negatively influenced the number of visits(Y) for both mangrove forest and silver beach which implies that as the travel cost and distance from native increases, the number of visits to the tourist spots decrease. On the other hand, size of group of tourists and annual income positively influenced the number of visits for both the tourist spots.
3.2.2 Estimation of consumer surplus
The results of consumer surplus estimation are presented in Table 5. It could be seen from the table that the consumer surplus per trip per person was estimated as the inverse of the travel cost coefficient and it was ₹.5000 for mangrove forest and ₹.1111 for silver beach. The number of visits undertaken per person was 5 for mangrove forest and 16 for silver beach and hence the consumer surplus per annum per person was ₹.25000 and ₹.17776 respectively for it. Taking into account the number of persons visiting the site, the estimated total consumer surplus for mangrove forest was ₹.199.84 crores and for silver beach, the consumer surplus was ₹.438.60crores. This high amount of consumer surplus for both the tourist spots suggested the need of government initiatives for conservation of both the tourist spots.
4. Summary and Conclusion
Major findings of the study are briefly stated below for a comprehensive review and to draw specific conclusion. The house features of sample fishermen revealed that building size, building quality and water quality was varied with pollution intensity. Distance of house from sea was also increased with pollution intensity. With regard to fuel for cooking, LPG connection was highest for low affected category with cent per cent connection and was lowest in serious affected category with 87.50 per cent LPG connection. Presence of toilet was also highest in low affected category with 75.00 per cent connection and the proportion was very less in serious and medium affected category with a proportion of 25.00 per cent and 32.50 per cent respectively. Finally, access to school and hospital was also coincided with pollution intensity and the accessibility was longer for serious and shorter for less affected.
Semi logarithmic hedonic model were employed for all three categories affected fishermen with independent variables of household income, water quality, distance from sea and amenities of respondents. For all the categories of affected fishermen, the house value was positively influenced by the household income, water quality, distance from sea and amenities. In seriously affected category, the water quality had negative influence on household income due to high pollution existed in that category.
The travel cost incurred by the tourists visiting mangrove forest was higher with ₹.1562 per visit as compared silver beach with ₹.487 per visit. The travel cost included the travel expenditure, entry cost and wage loss. Of the total travel cost, for mangrove forest, wage loss accounted for the highest proportion with 48 per cent. For silver beach, Travel expenditure accounted for the highest proportion with 51.00 per cent. In measuring consumer surplus, the travel cost and distance from native, negatively influenced the number of visits(Y) for both mangrove forest and silver beach which implies that as the travel cost and distance from native increases, the number of visits to the tourist spots decrease. On the other hand, size of group of tourists and annual income positively influenced the number of visits for both the tourist spots.
The consumer surplus per trip per person was estimated as the inverse of the travel cost coefficient and it was ₹.5000 for mangrove forest and ₹.1111 for silver beach. The consumer surplus per annum per person was ₹.25000 and ₹.17776 respectively for mangrove forest and silver beach respectively. The estimated total consumer surplus for mangrove forest was ₹.199.84 crores and for silver beach, the consumer surplus was ₹.438.60 crores. This high amount of consumer surplus for both the tourist spots suggested the need of government initiatives for conservation of both the tourist spots.
5. Policy Implications
The results of hedonic model revealed that the house value was influenced by water quality and hence concretized efforts should be taken by the State Government to improvise the water quality by establishing desalinization plant using reverse osmosis in SIPCOT industrial plant. The travel cost estimation for tourism revealed that the estimated total consumer surplus for mangrove forest was ₹.199.84 crores and for silver beach, the consumer surplus was ₹.438.60. This suggested the need of government initiatives for conservation of both the tourist spots.
Bhat,M.G. 2003. Application of non-market valuation to the Florida Keys marine reserve management. Journal of Environmental Management. 67 (4), 315-325.
http://dx.doi.org/10.1016/S0301-4797(02)00207-4
Legget, C.G.,Bockstael, N.E. (2000), "Evidence of the Effects of Water Quality on Residential Land Prices", Journal of Environmental Economics and Management, 39, pp. 121-144.
http://dx.doi.org/10.1006/jeem.1999.1096
Pompe, J. J and Rinehart, J.R. 1995, "Beach Quality and the Enhancement of Residential Property Values", Journal of Leisure Research,27 (23) pp.143 - 154.
Smith, K.V., Desvousges, W.H., Fisher, A. 1986.A Comparison of Direct and Indirect Methods for Estimating Environmental Benefits.American Journal of Agricultural Economics 68 (2), 280-290.


. PDF(377KB)
. FPDF(win)
. HTML
. Online fPDF
Associated material
. Readers' comments
Other articles by authors
. J.S. Amarnath
. A. Mouna
Related articles
. Externalities
. Hedonic model
. Travel cost model
. Consumer surplus
Tools
. Email to a friend
. Post a comment