Southern Caribbean Hurricane Case Study: Observations and WRF Simulation 
2. Physics Department, Univ. Puerto Rico Mayagüez, USA
3. Univ. Zululand, KwaDlangezwa, South Africa
 Author
  Correspondence author
International Journal of Marine Science, 2016, Vol. 6, No. 39 doi: 10.5376/ijms.2016.06.0039
Received: 28 Aug., 2016 Accepted: 13 Oct., 2016 Published: 13 Oct., 2016
Chiao S., and Jury M.R., 2016, Southern Caribbean Hurricane Case Study: Observations and WRF Simulation, International Journal of Marine Science, 6(39): 1-13 (doi:10.5376/ijms.2016.06.0039)
The meteorological conditions of three hurricanes passing through the southern Caribbean are analyzed using Hurdat, atmosphere - ocean reanalysis, satellite rainfall and SST fields, and buoy observations. The cases are Ivan 2004, Emily 2005 and Dean 2007, each traced to an African easterly wave moving zonally beneath an atmospheric ridge over the North Atlantic. SST were > 29oC west of the Antilles Islands due to +40 W/m2 surplus net heat flux and weak upper ocean currents. The analysis results suggested that the warm sea temperatures enhanced moisture fluxes, rain rates and convective heating, which affected these hurricanes significantly.
WRF model simulations at 3 km resolution are evaluated for ability to forecast intensification up to 48 h lead time. In Emily (2005), the simulation results showed that upper winds disrupt the outflow. As the result, the model recovers the vortex too slowly. Overall, the WRF forecast decrease in central pressure was close to observed in Ivan (2004), but less than half of the observed in Dean (2007). Although the WRF model simulations gave evidence of initialization and intensification errors in comparison with NHC observations, the WRF 3 km resolution domain is essential for improving hurricane wind simulations. Nevertheless, significant improvements still depended on the initialization and data assimilation.
Introduction
About 10% of tropical storms passing through the southeastern Caribbean reach hurricane strength in the months July, August, September (Tartaglione et al., 2003; Klotzbach, 2011). These can bring floods and destruction to Antilles Islands, depending on their intensity and track, and interaction with the surrounding environment (Frank and Ritchie, 2001; Aiyyer and Thorncroft, 2006; Jury and Rodriguez, 2011). The most detrimental impacts occur in the northern quadrant of hurricanes, where eyewall winds and rainfall are strongest (Black and Willoughby, 1992; Beven and Kimberlain, 2009). Our understanding of hurricanes reaching the USA has matured (Landsea, 1993; Elsner et al., 1999; Elsner et al., 2000; Elsner et al., 2006) while the Caribbean is receiving increasing attention (Jury et al., 2011; Klotzbach, 2011). Wang et al (2006) determined that a large Atlantic warm pool favors increased Caribbean hurricane frequency due to surplus heat and coincident easterly wind shear, even with the influence of Pacific El Nino Southern Oscillation (ENSO) statistically removed. Klotzbach (2011) found a compounding effect of the Atlantic Multidecadal Oscillation and ENSO, leading to a 10-fold increase in Caribbean hurricane days.
Hurricane tracks tend to split east of the Antilles Islands and either veer into the Atlantic or remain in the Caribbean depending on the position of the sub-tropical ridge (Fig. 1). Kimball and Mulekar (2004) and Kossin et al (2010) found that hurricanes above category three usually track westward along 15°N, originate from African easterly waves, and make landfall in the Gulf of Mexico. Changes in Caribbean hurricane intensity (Jury et al., 2011) have been related to intra-seasonal oscillations of zonal wind shear and sea surface temperatures (SST) particularly along the coast of Venezuela. The Amazon and Orinoco River plumes spread into the Antilles Islands (Vizy and Cook, 2010), creating a buoyant surface layer that amplifies heat fluxes available to hurricanes.
.png) Figure 1 (a) EOF-2 of tropical storm probability 1979-2012 arbitrarily shaded ±1σ, (b) annual time series in the Antilles zone. (c) JAS climatology of tropical storm frequency and satellite rainfall stratified by latitude averaged over 60-64W. Hurricane icon in (a) refers to mean position of cases. |
Numerical weather prediction models are well tuned for mid-latitude scenarios, but tropical cyclones are more difficult to simulate (Braun, 2002). Mesoscale cloud-resolving models are showing increasing skill in track and intensity forecasts for hurricanes at multi-day lead times (McAdie and Lawrence, 2000; Franklin et al., 2003; DeMaria et al., 2005). National Hurricane Center (NHC) track forecast errors have decreased 1% a year since 1980 (Goerss, 2000; McAdie and Lawrence, 2000; Aberson, 2001) through improved models and data assimilation (Elsberry, 2005). However model sensitivity to global initialization data and parameterization options (Gallus and Bresch, 2006; Michelson and Bao, 2008) are often untested, so forecasters must uncover bias in successive operational applications. 48 h track forecast errors in the Leeward Antilles still exceed 100 km (Jury et al., 2011).
To improve forecast guidance, this study evaluates the environmental features of southern Caribbean hurricanes and factors underlying their intensification. Moreover, high resolution WRF model simulations are made for three cases passing through the southern Caribbean. In section 2 the data and methods are outlined. Section 3 provides case study results in the context of climatology and composite analyses, and discussions are given in Section 4.
2. Data and Methods
Our climatology of tropical storms during the satellite era is based on NHC observations interpolated to half-degree grid (Emanuel, 2005). An Empirical Orthogonal Function (EOF) analysis is made to identify the path density and frequency in time. Meridional gradients along the Antilles island chain (±62°W) are studied for tropical storm probability and rainfall from quarter-degree three-hourly multi-satellite measurements (cMorph, Joyce et al., 2004) and half-degree Simple Ocean Data Assimilation (SODA) reanalyses (Giese and Carton, 2008) in the July to September season.
The NHC hurricane database (Hurdat, Landsea et al., 2004) is used to define specific cases for study using a criteria of sustained winds above 33 m/s passing within 250 km of 13°N, 62°W. Since the year 2000, three hurricanes reach the threshold: Ivan 7-8 September 2004, Emily 14-15 July 2005, and Dean 17-18 August 2007. The large scale steering flow and NOAA sea surface temperatures (SST) were analyzed. Marine conditions are characterized by monthly SODA sub-surface temperature and European Community Medium-range Weather Forecasts (ECMWF, Dee et al., 2011) wind stress anomalies composited over August 2004, July 2005 and August 2007. The surface net heat budget just west of the Antilles island chain is calculated via daily half-degree NASA MERRA reanalysis (Rienecker et al., 2011): net in-coming and outgoing radiation, latent and sensible heat flux. Three-hourly cMorph rainfall data are analyzed as hovmoller plots for each case, by averaging the values over the 11-17°N band from Jamaica to Africa (85°W-20°W). Once the hurricanes pass west of 50°W, the Hurdat data is extracted for track position and intensity in terms of minimum pressure and maximum wind.
Surface winds at quarter-degree resolution are analyzed from QuikScat satellite over-passes (Brennan et al., 2009). For hurricanes Ivan and Dean individual wind maps were studied, while in Emily the previous week’s wind analysis revealed a wind shadow west of the Antilles Islands. Hurricanes Emily and Dean passed over two NDBC buoys (15.2°N, 67.6°W and 15°N, 75°W), and hourly data were analyzed for sea and air temperature, dewpoint temperature, wind speed and gust, wind direction, air pressure, wave height and wave period. Comparisons of buoy and Wavewatch version 3 (WAMv3) model (Tolman, 2002) wave heights and cMorph satellite rainfall were made. GOES infrared cloud top temperature images were analyzed near the time of concentric eyewall formation. Pu et al (2009) provide a comparative study of hurricane Emily and forecasts using in-situ data initialization.
The Global Forecast System Analysis 1-degree (GFS-ANL) dataset was used as forcing data for Weather Research and Forecasting (WRF) model runs, and represent the data assimilation prior to GFS model forecast. The physics parameterizations were guided by earlier sensitivity studies on hurricane Helene in the Atlantic (Tompkins and Chiao, 2012) and include: Lin microphysics (Hong et al., 2006), Mellor-Yamada-Janjic TKE (Janjic, 2001), RUC-NOAH land-surface model, Goddard shortwave radiation (Chou and Suarez, 1994), and Rapid Radiative Transfer Model (Mlawer et al., 1997).
The Advanced Research Weather Research and Forecasting (WRF-ARW) v3.5 was configured with a horizontal grid of 3 km over the southern Caribbean, a resolution deemed suitable by Davis et al (2010), with 61 vertical sigma levels from surface to 50 hPa. WRF model simulations commence when the hurricane reaches 55°W, which for Ivan is 7 September 2004, Emily: 14 July 2005, and Dean: 17 August 2007. Outputs of simulated radar reflectivity / SLP and 0-5 km wind shear / 850 hPa winds were made at three hourly intervals. Case studies use the 24 and 48 hour forecasts to evaluate track and intensity against NHC observed values, as in Chen et al (2011). Earlier attempts to simulate these hurricanes using ERA-Interim reanalysis produced greater bias (than GFS initialization) in comparison with NHC observations.
Our results are structured by climatology of Hurdat track and intensity, air-sea features of composite hurricanes, case study observations for the three hurricanes and model simulations in the southern Caribbean. A range of observations and a limited set of simulations are analyzed.
3. Results
3.1 Climatology and background
Cyclogenesis in the southern Caribbean is often subdued in mid-summer because of Saharan dust and upper westerly winds (Jury et al., 2007; Jury and Santiago, 2010). Temporal fluctuations of tropical storms in the southern Caribbean reflect active periods: 1979-80, 1986-88, 1994 and from 2001-07 (Fig 1b). Historical peaks occurred in 2004 and 2007. The annual probability of tropical storms (Fig 1c) is relatively steady at 0.40 from 17-14°N and increases to 0.50 from 14-12°N. Tropical storm probability declines toward South America with cooler SST and lower Coriolis values. The satellite rainfall averaged along the Antilles island chain shows fluctuations from a mean of 2.5 mm/day. Lower rain rates (2 mm/day) are measured near 14°N and 11°N, but higher values are observed on the South American coast > 3.5 mm/day.
3.2 Composite environment and statistics
In this section we analyze composite features before and during the three hurricanes, starting with the monthly data on oceanography and wind stress. Fig 2a illustrates sea temperature anomalies in the upper 300 m from SODA reanalysis averaged over 11-17°N in August 2004, July 2005 and August 2007. To the west of the Antilles there is a warm pool (>+1°C) in the layer 60-160 m: sufficient heat was available for storm intensification. Consistent with that feature, wind stress anomalies over the southern Caribbean reflected weakened trade winds (Fig 2b). As a result, coastal upwelling off Venezuela was diminished. Temporal fluctuations of the heat and radiation budget are shown for each case in Fig 2c. All three exhibit upward trends prior to hurricane development, and a positive net budget. Oscillations are attributed to reduced solar radiation during cloudy spells preceding the hurricane.
.png) Figure 2 SODA composite anomalies: (a) E-W depth section of temperature averaged 11-17N, (b) ECMWF wind stress vectors (max = .02 N/m2) and zonal component (shaded +/–.07 N/m2); both averaged over months Aug 04, Jul 05, Aug 07. (c) Daily surface net outgoing and incoming radiation, and latent and sensible heat flux from MERRA model in the area 11-17N, 62-67W west of the Antilles before and during case study hurricanes. |
The precursor easterly wave structure and propagation characteristics for each case are studied using cMorph rainfall hovmoller plots from Jamaica to Africa, averaged in the 11-17°N band. All three systems can be traced to cloud clusters sweeping off West Africa at ~5 m/s (Fig 3a-c). In the cases of Ivan and Emily, convection weakened in the east Atlantic (20-40°W). The easterly wave precursor to Dean maintained a more constant phase speed and intensity.
The synoptic scale condition was dominated by a ridge of high pressure in the 850-400 hPa layer across the North Atlantic (±30°N). Thus deep easterly winds steered the hurricanes westward. NHC hurdat track and intensity data are displayed in Figs 4a - b. Ivan (2004) and Emily (2005) exhibited very similar tracks, passing the Antilles island chain near 12°N (Grenada), whereas Dean (2007) passed near Martinique at 15°N. Emily started off as a weak system, but Ivan and Dean had reached category 1 by 55°W. All cases intensified just west of the Antilles island chain, where SST were > 29°C. Dean’s winds doubled in strength from 61° to 67°W. All three hurricanes weakened in the longitudes 72-74°W, where SST were cooler.
.png) Figure 3 Hovmoller plot of satellite rainfall in the band 11-17°N, before and during the period of each case: (a) Ivan 2004, (b) Emily 2005, (c) Dean 2007, with convection outside the system masked. |
.png) Figure 4 (a) Tracks of three hurricanes and (b) intensity according to HURDAT maximum wind. Topography given in (a). |
3.3 Case studies
a. Ivan (2004)
The NHC report on hurricane Ivan (Stewart, 2004) typifies southern Caribbean hurricanes that develop from a large tropical wave moving off the coast of Africa at the end of August 2004. The convective vortex intensified under favorable easterly shear near 10°N and tracked westward toward Trinidad. The vortex intensified (dP/dt = -39 hPa/day) near Grenada reaching category 5 enroute to Jamaica. A subtropical ridge to the north sustained westward movement of 5 m/s. NHC forecast models had a poleward track bias through the southern Caribbean.
The QuikScat wind field on 8 September 2004 (Fig 5a) illustrates >70 kt easterly winds north of the center. The pattern appears as an open wave because the return flow south of the center is close to land. The GOES IR image on 8 September highlights a concentric eyewall with cloud top temperatures < -70°C extending ~100 km outward. Cloud bands are seen swirling around and north of the hurricane at a distance of ~300 km.
.png) Figure 5 September 2004 Ivan case study: (a) 10UTC 9th QuickScat surface winds, (b) 18UTC 8th GOES IR cloud top temperatures. |
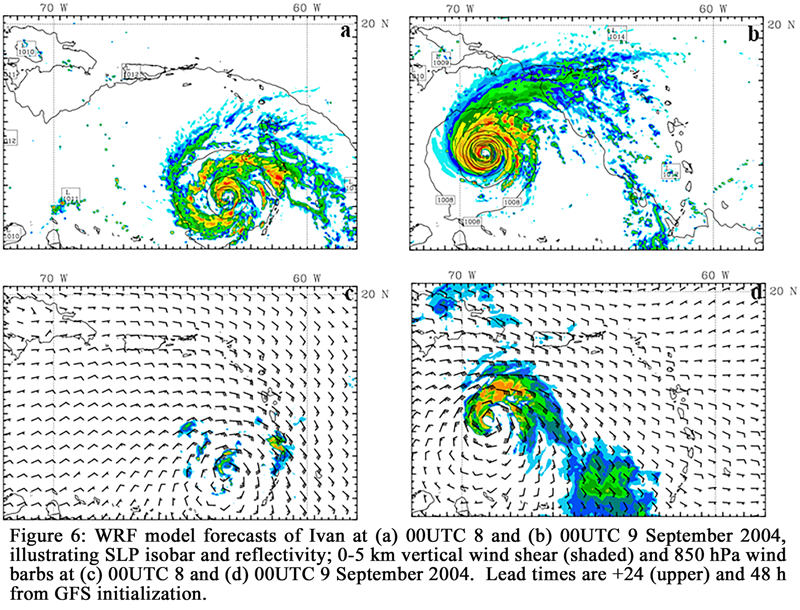 Figure 6 WRF model forecasts of Ivan at (a) 00UTC 8 and (b) 00UTC 9 September 2004, illustrating SLP isobar and reflectivity; 0-5 km vertical wind shear (shaded) and 850 hPa wind barbs at (c) 00UTC 8 and (d) 00UTC 9 September 2004. Lead times are +24 (upper) and 48 h from GFS initialization. |
The model simulated results show that the low pressure center went from 990 hPa on 00UTC 8 September to 948 hPa on 00UTC 9 September (Fig 6a; b). The low center moved northwestward from 63°W to 69°W with winds increasing > 37.5 m/s as well as low vertical wind shear (5 ~ 10 m/s) from 8 to 9 September 00UTC (Figs. 6c; d), indicating rapid intensification during this 24 h period. The surface low pressure was also reflected at 500 hPa as a tropical trough (not shown). Rapid intensification was attributed to the high SST (cf. Fig 2a). Mainelli et al (2008) show that inclusion of sub-surface heat content improved Ivan forecasts by 20%.
b. Emily (2005)
Prior to the development of hurricane Emily, Quikscat winds were low (< 3 m/s) west of the Antilles Island chain (61-63°W). The resultant surplus heat contributed to a drop in central pressure from 1003 to 952 hPa in a 36 h period, as Emily passed from 58 to 68°W. The GOES IR image (Fig 7) indicates eyewall formation with cloud top temperatures < -70°C extending 100 km outward. In the eastern quadrant the incoming cloud band had air of low aerosol concentration, according to NASA ozone monitoring instrument (OMI) satellite data. Moreover, radiosonde-measured CAPE exceeded 2000 J/kg just following hurricane passage on 00UTC 16 July 2005 at Curacao (12°N, 69°W).
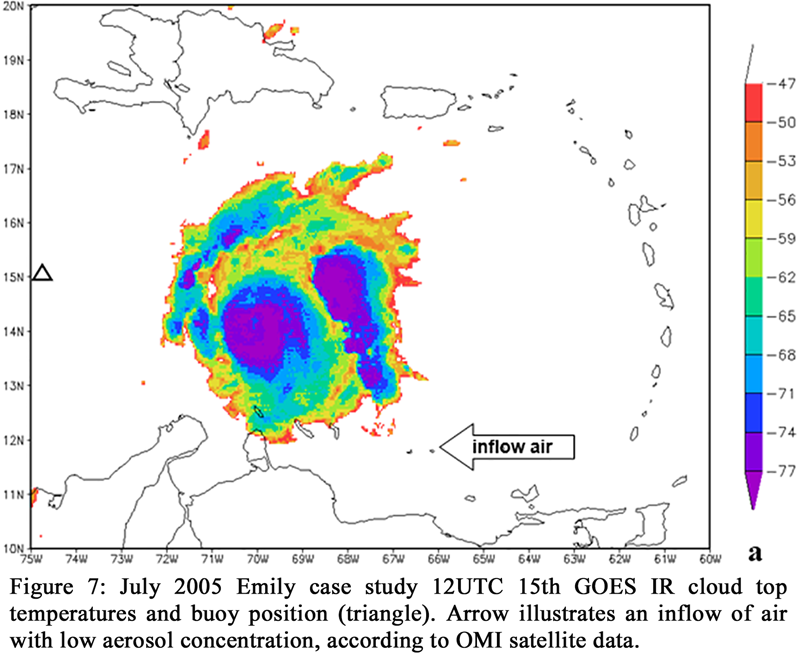 Figure 7 July 2005 Emily case study 12UTC 15th GOES IR cloud top temperatures and buoy position (triangle). Arrow illustrates an inflow of air with low aerosol concentration, according to OMI satellite data. |
Hurricane Emily passed near a NDBC buoy at 15°N, 75°W and hourly data are presented in Figs. 8a-d. Winds gusted up to 22 m/s at the time of directional switch from north to south on 16 July 2005. Steady SST of 29°C contrasted with air temperatures that dropped below 26°C during rainy spells on 15 and 16 July. The pressure minimum near 1000 hPa coincided with sustained rain rates > 10 mm/hr. At that time wave heights exceeded 7 m with a period of 15 sec. WAMv3 estimated wave heights were near 5 m and the timing was close to observed (Fig. 8d).
The WRF simulation reflects intensification (Figs 9a; b) consistent with observations (cf. Fig 4b). The low pressure center (989 hPa) was near 13°N, 63°W on 18UTC 14 July (Fig 9a). By 18UTC 15 July (Fig 9b), the system moved northwestward to 15°N, 72°W with a central pressure of 969 hPa. Although Emily was embedded in favorable conditions, the model simulated winds remained in category 1 strength. The simulated vertical wind shear on 18UTC 14 and 15 July increased around the storm (Figs. 9c, d). As the upper outflow vortex encountered westerly winds from 12 UTC 15 to 00 UTC 16 July, Emily’s circular rain bands split up near 15°N, 72°W. The model simulated central pressure was close to Hurdat observations (< 969 hPa), so the initialization fields captured the lack of intensification. Pu et al. (2009) demonstrate that a finer model horizontal resolution produces a deeper storm. However, specialized data assimilation would be needed to reproduce the eyewall structure.
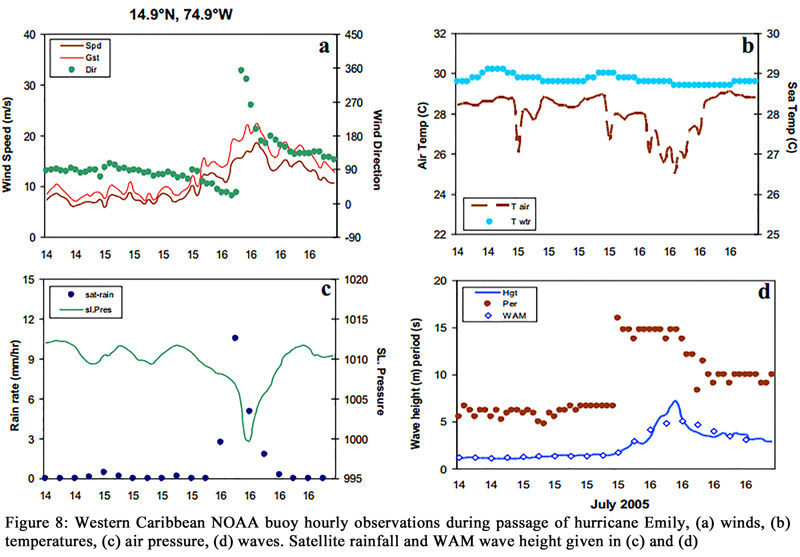 Figure 8 Western Caribbean NOAA buoy hourly observations during passage of hurricane Emily, (a) winds, (b) temperatures, (c) air pressure, (d) waves. Satellite rainfall and WAM wave height given in (c) and (d). |
c. Dean (2007)
Case study observations for hurricane Dean include a QuikScat wind field and GOES IR images on 18 August 2007 (Figs. 10a-c). With the center located further north, a complete spiral vortex was observed to cover the southern Caribbean. Maximum winds > 65 kts (34 m/s) were observed by QuikScat north of the system (Fig. 10a). Curacao radiosonde CAPE exceeded 4000 J/kg just following hurricane passage 0UTC 19 August 2007 (not shown). The GOES IR image illustrates cloud top temperatures < -70°C extending 150 km outward to the southwest. At 00UTC 18 August a cloud band over the Antilles island chain fed in from be-hind the center (Fig. 10b), similar to Emily. By 12UTC the eye of hurricane Dean remained open compared to other cases (Fig. 10c), likely related to the more northward track and consequently weaker influence of friction and upwelling off South America.
NDBC buoy hourly observations during passage of hurricane Dean (Fig 11a-d) show wind gusts of 34 m/s at the time of direction switch from north to south on 18 August 2007. Similar to Emily, steady SST of 29°C contrasted with air temperatures that dipped below 26°C during rainy spells. Fluctuations of dewpoint temperature up to 3°C were observed just before the pressure minimum passed the buoy (974 hPa). Sustained rain rates of 12 mm/hr were estimated by satellite, as wave heights reached 10 m (08UTC 18 Sep), the highest ever recorded by buoy in the Caribbean. WAMv3 estimated wave heights were about half those observed (Fig. 11d), likely due to GFS wind forcing at one-degree resolution (Chao and Tolman, 2010).
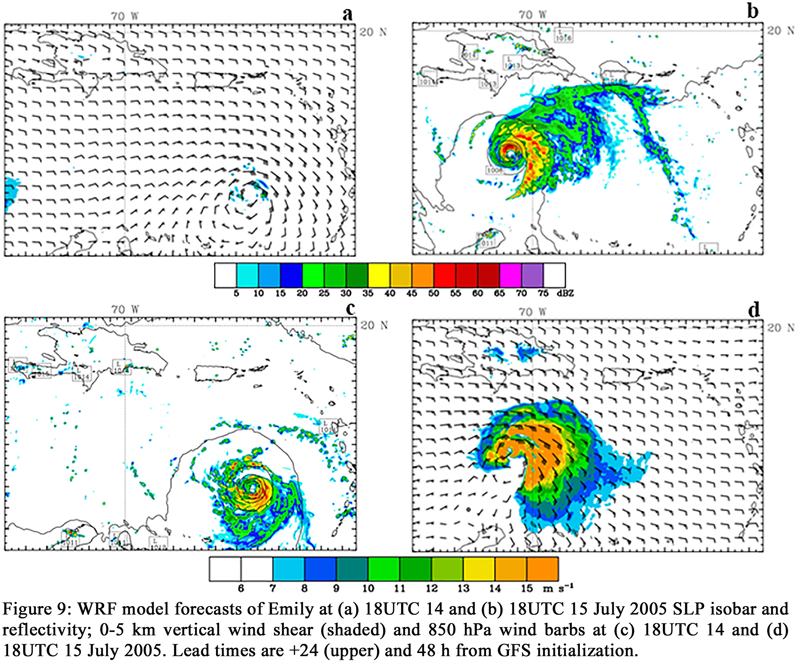 Figure 9 WRF model forecasts of Emily at (a) 18UTC 14 and (b) 18UTC 15 July 2005 SLP isobar and reflectivity; 0-5 km vertical wind shear (shaded) and 850 hPa wind barbs at (c) 18UTC 14 and (d) 18UTC 15 July 2005. Lead times are +24 (upper) and 48 h from GFS initialization. |
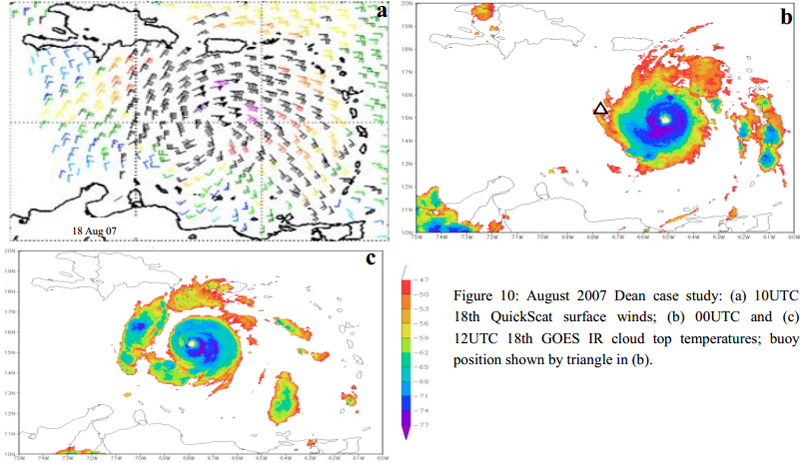 Figure 10 August 2007 Dean case study: (a) 10UTC 18th QuickScat surface winds; (b) 00UTC and (c) 12UTC 18th GOES IR cloud top temperatures; buoy position shown by triangle in (b).. |
WRF model simulations (Figs. 12c; b) show rapid development of hurricane Dean in the study area. The central pressure deepened from 970 hPa to 944 hPa from 12 UTC 17 to 12UTC 18 August. Hurricane strength winds wrapped around the north side of the eye. Vertical wind shear of ~15 m/s was simulated (Figs. 12c; d), as highest reflectivity rotated to the southeasterly quadrant, a feature consistent with Meteo-France radar on Martinique (not shown).
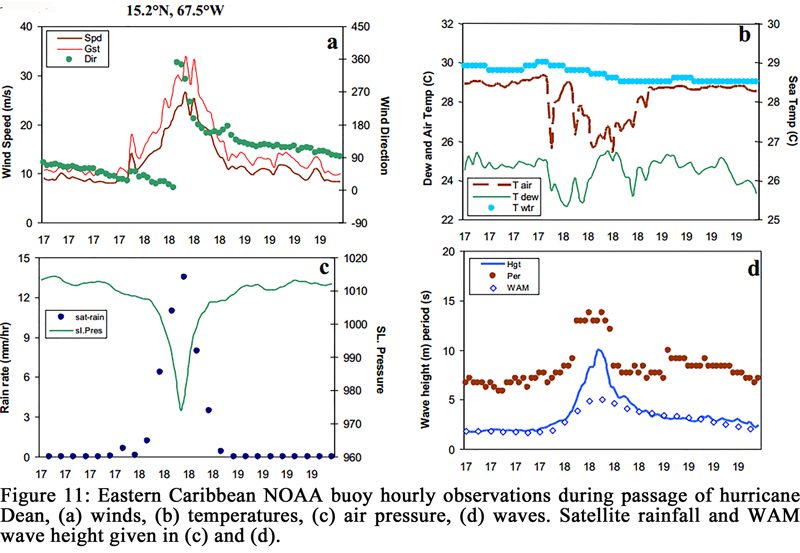 Figure 11 Eastern Caribbean NOAA buoy hourly observations during passage of hurricane Dean, (a) winds, (b) temperatures, (c) air pressure, (d) waves. Satellite rainfall and WAM wave height given in (c) and (d). |
4. Summary and Conclusions
Our analysis has presented regional observations and high resolution model simulations of hurricanes passing through the southern Caribbean, with a focus on three cases: Ivan 7-8 September 2004, Emily 14-15 July 2005, and Dean 17-18 August 2007. In general, the synoptic settings include: 1) Trade winds and associated upwelling along the coast of South America slackened before passage of these hurricanes; 2) SST above 29°C may have contributed to rapid intensification over the eastern Antilles; and 3) An upper ridge east of Florida kept hurricanes on a westerly path.
The WRF model simulations provide evidence that the WRF 3km resolution domain is essential for improving hurricane wind simulations which is consistent with Davis et al., (2010). Nevertheless, the initialization (i.e., forcing data and data assimilation) of the model is the key to improve simulated intensification processes in comparison with NHC observations. Table 1 summarize comparisons between model track/intensity and observations. Some differences between observed and modeled sea level pressure relate to comparison of point value and grid box average. The WRF +24 h forecast for Ivan was 990 hPa against NHC observed 950 hPa (00UTC 8 Sep). The model +48 h forecast was 948 hPa vs 938 hPa. Ivan’s ΔP of -42 hPa model versus -12 hPa observed indicates that the simulation caught up with reality, from a +40 hPa bias near initialization (Table 1). It is also our speculation that intensification of Ivan was partly attributed to the high SST (cf. Fig 2a). Mainelli et al (2008) also suggested that inclusion of sub-surface heat content improved Ivan forecasts by 20%.
The WRF +24 h central pressure for Emily was 989 hPa against NHC observed 971 hPa (18UTC 14 Jul); while the model +48 h forecast was consistent with observed at 969 hPa. With a model ΔP of -20 hPa versus -2 hPa observed, the simulation under-represented the disrupted upper outflow (cf. Gopalakrishnan et al. 2010). The WRF +24 hr forecast for Dean was 970 hPa against NHC observed 967 hPa (12UTC 17 Aug); while our model +48 hr forecast was 944 hPa against NHC observed 923 hPa. The model ΔP of -26 hPa versus -44 hPa observed reveals a weak intensity forecast that derived from initialization bias (+21 hPa), and vertical wind shear. Track forecasts were close to reality (not shown), due to the steady westward progression enforced by a strong upper ridge east of Florida. The litmus test came with our intensity forecasts. Apparently, high spatial resolution (e.g., 3 km) is definitely a need for hurricane simulations, even though significant improvements of simulated intensification still depended on the initialization data.
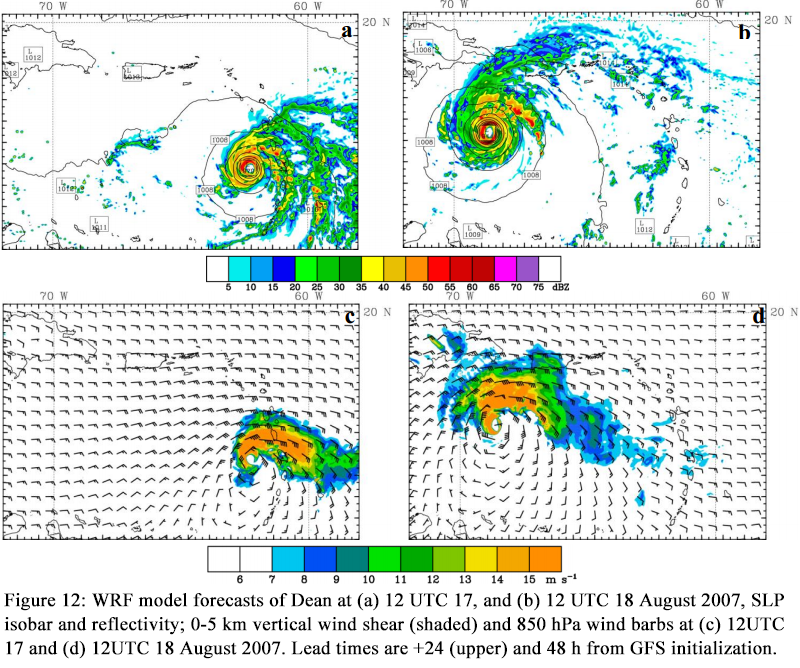 Figure 12 WRF model forecasts of Dean at (a) 12 UTC 17, and (b) 12 UTC 18 August 2007, SLP isobar and reflectivity; 0-5 km vertical wind shear (shaded) and 850 hPa wind barbs at (c) 12UTC 17 and (d) 12UTC 18 August 2007. Lead times are +24 (upper) and 48 h from GFS initialization. |
.png) Table 1 NHC observed and WRF model minimum central pressure (hPa) at two times (as in figures 6, 9, 12) (upper), and modelobs bias and pressure tendency (lower). |
Further studies could include: 1) testing of higher resolution initialization products for a closer fit to reality (cf. Krishnamurti et al., 1997); 2) evaluation of simulated upper wind interaction with the outflow vortex; and 3) analysis of Antilles Island impact on latent heat fluxes and upper ocean processes. The final point will grow in importance as coupled ensemble weather models take hurricane forecasts to extended lead times.
Acknowledgements
We acknowledge the suppliers of datasets utilized in this research. NSF provided initial funding of this project at the Physics Dept., Univ. Puerto Rico Mayaguez. On-going SAPSE support from South Africa is acknowledged by the second author. Partly supported from NSF AGS-1209296 and NASA Grant NNX15AQ02A to the first author is also acknowledged. The authors declare that there is no conflict of interest regarding the publication of this paper.
Aberson S. D., 2001, The ensemble of tropical cyclone track forecasting models in the North Atlantic basin (1976–2000). Bull. Amer. Meteor. Soc., 82, 1895–1904
http://dx.doi.org/10.1175/1520-0477(2001)082%3C0000:TEOTCT%3E2.3.CO;2
Aiyyer A. R., Thorncroft C., 2006, Climatology of vertical wind shear over the tropical Atlan-tic, J. Climate, 19, 2969-2983.
http://dx.doi.org/10.1175/JCLI3685.1
Beven J. L., Kimberlain T. B., 2009, Tropical cyclone report: Hurricane Gustav. National Hur-ricane Center Rep., 38 pp.
Black M. L., Willoughby H. E., 1992, The concentric eyewall cycle of Hurricane Gilbert. Mon. Wea. Rev., 120, 947-957
http://dx.doi.org/10.1175/1520-0493(1992)120%3C0947:TCECOH%3E2.0.CO;2
Braun S. A., 2002, A cloud-resolving simulation of Hurricane Bob (1991): Storm structure and eyewall buoyancy. Mon. Wea. Rev., 130, 1573-1592
http://dx.doi.org/10.1175/1520-0493(2002)130%3C1573:ACRSOH%3E2.0.CO;2
Brennan M. J., Hennon C. C. and Knabb R. D., 2009, The operational use of QuikScat ocean surface vector winds at the National Hurricane Center. Wea. Forecasting, 24, 621–645
http://dx.doi.org/10.1175/2008WAF2222188.1
Carton J. A., Giese B. S., 2008, A Reanalysis of ocean climate using Simple Ocean Data As-similation (SODA). Mon. Wea. Rev., 136: 2999-3017
http://dx.doi.org/10.1175/2007MWR1978.1
Chao Y. Y., Tolman H. L., 2010, Performance of NCEP regional wave models in predicting peak sea states during the 2005 North Atlantic hurricane season. Wea. Forecasting, 25, 1543–1567
http://dx.doi.org/10.1175/2010WAF2222309.1
Chen H., Zhang D. L. , Carton J., Atlas R., 2011, On the rapid intensification of hurricane Wilma (2005). part I: model prediction and structural changes. Wea. Forecasting, 26, 885–901
http://dx.doi.org/10.1175/WAF-D-11-00001.1
Davis C., Wang W., Dudhia J., Torn R., 2010, Does increased horizontal resolution improve hurricane wind forecasts?. Wea. Forecasting, 25, 1826–1841
http://dx.doi.org/10.1175/2010WAF2222423.1
DeMaria M., Mainelli M., Shay L. K., Knaff J. A., Kaplan J., 2005, Further Improvements to the Statistical Hurricane Intensity Prediction Scheme (SHIPS), Wea. Forecasting, 20, 531-543
http://dx.doi.org/10.1175/WAF862.1
Elsberry R. L., 1995, Recent advancements in dynamical tropical cyclone track predictions. Meteor. Atmos. Phys., 56, 81–99
http://dx.doi.org/10.1007/BF01022522
Elsner J. B., Kara A. B., Owens M. A., 1999, Fluctuations in north Atlantic hurricane fre-quency, J. Climate, 12, 427-437
http://dx.doi.org/10.1175/1520-0442(1999)012%3C0427:FINAHF%3E2.0.CO;2
Elsner J. B., Jagger T. H., Niu X., 2000, Shifts in the rates of major hurricane activity over the North Atlantic during the 20th century. Geophys. Res. Lett, 27, 1743–1746
http://dx.doi.org/10.1029/2000GL011453
Elsner J. B., Tsonis A. A., Jagger T. H., 2006, High-frequency variability in hurricane power dissipation and its relationship to global temperature. Bull. Amer. Met. Soc., 763–768
Emanuel K., 2005, Increasing destructiveness of tropical cyclones over the past 30 years, Nature, 436, 686– 688
http://dx.doi.org/10.1038/nature03906
Frank W. M., Ritchie E. A., 2001, Effects of vertical wind shear on hurricane intensity and structure. Mon. Wea. Rev., 129, 2249-2269
http://dx.doi.org/10.1175/1520-0493(2001)129%3C2249:EOVWSO%3E2.0.CO;2
Franklin J. L., McAdie C. A., Lawrence M. B., 2003, Trends in Track Forecasting for Tropical Cyclones Threatening the United States, 1970–2001. Bull. Amer. Meteor. Soc., 84, 1197–1203
http://dx.doi.org/10.1175/BAMS-84-9-1197
Goerss J. S., 2000, Tropical cyclone track forecasts using an ensemble of dynamical models. Mon. Wea. Rev., 129, 1187-1193
http://dx.doi.org/10.1175/1520-0493(2000)128%3C1187:TCTFUA%3E2.0.CO;2
Gopalakrishnan S. G., Goldenbergs S., Quirino T., Zhang X., Marks F., Yeh J. S., Atlas R., Tallapragada V., 2012, Toward improving high-resolution numerical hurricane forecast-ing: influence of model horizontal grid resolution, initialization and physics. Wea. Fore-casting, 27, 647–666
http://dx.doi.org/10.1175/WAF-D-11-00055.1
Joyce R. J., Janowiak J. E., Arkin P. A., Xie P. P., 2004, CMORPH: A method that produces global precipitation estimates from passive microwave and infrared data at high spatial and temporal resolution. J. Hydrometeorol., 5, 487-503
http://dx.doi.org/10.1175/1525-7541(2004)005%3C0487:CAMTPG%3E2.0.CO;2
Jury M. R., Winter A., Malmgren B., 2007, Sub-regional precipitation climate of the Caribbe-an and relationships with ENSO and NAO, J Geophys. Res 112, D16107, doi:10.1029/2006JD007541
http://dx.doi.org/10.1029/2006JD007541
Jury M. R., Santiago M. J., 2010, Composite analysis of dust impacts on African easterly waves in the MODIS era. J. Geophys. Res. Atmos doi:10.1029/2009JD013612
http://dx.doi.org/10.1029/2009JD013612
Jury M. R., Rios-Berrios R., Garcia E., 2011, Caribbean hurricanes: changes of intensity and track prediction, Theor. Appl. Climatol., 107, 297-311
http://dx.doi.org/10.1007/s00704-011-0461-5
Jury M. R., Rodriguez E., 2011, Caribbean hurricanes: interannual variability and prediction. Theor. Appl. Climatol., 106, 105-115
http://dx.doi.org/10.1007/s00704-011-0422-z
Kimball S. K., Mulekar M. S., 2004, A 15-Year Climatology of North Atlantic Tropical Cy-clones. Part I: Size Parameters. J. Climate, 17, 3555–3575
http://dx.doi.org/10.1175/1520-0442(2004)017%3C3555:AYCONA%3E2.0.CO;2
Klotzbach P. J., 2011, The Influence of El Niño–Southern Oscillation and the Atlantic Mul-tidecadal Oscillation on Caribbean Tropical Cyclone Activity. J. Climate, 24, 721–731
http://dx.doi.org/10.1175/2010JCLI3705.1
Kossin J. P., Camargo S. J., Sitkowski M., 2010, Climate modulation of North Atlantic hurri-cane tracks. J. Climate, 23, 3057–3076
http://dx.doi.org/10.1175/2010JCLI3497.1
Krishnamurti T. N., Correa-Torres R., Rohaly G., Oosterhof D., Surgi N., 1997, Physical ini-tialization and hurricane ensemble forecasts. Wea. Forecasting, 12, 503–514
http://dx.doi.org/10.1175/1520-0434(1997)012%3C0503:PIAHEF%3E2.0.CO;2
Landsea C. W., 1993, A climatology of intense Atlantic hurricanes. Mon. Wea. Rev., 121, 1703–1713
http://dx.doi.org/10.1175/1520-0493(1993)121%3C1703:ACOIMA%3E2.0.CO;2
Landsea C. W., co-authors, 2004, The Atlantic (hurricane) database re-analysis project: doc-umentation for 1851-1910 alterations and additions to HURDAT. In Hurricanes and Typhoons: Past, Present and Future, Murnane and Liu, eds., Columbia Univ. Press, 464 pp
Mainelli M., DeMaria M., Shay L. K., Goni G., 2008, Application of oceanic heat content estimation to operational forecasting of recent Atlantic category 5 hurricanes. Wea. Forecasting, 23, 3–16
http://dx.doi.org/10.1175/2007WAF2006111.1
McAdie C. J., Lawrence M. B., 2000, Improvements in tropical cyclone track forecasting in the Atlantic basin, 1970-98. Bull. Amer. Meteor. Soc., 81, 989-997
http://dx.doi.org/10.1175/1520-0477(2000)081%3C0989:IITCTF%3E2.3.CO;2
Nasrollahi N., AghaKouchak A., Li J., Gao X., Hsu K., Sorooshian S., 2012, Assessing the impacts of different WRF precipitation physics in hurricane simulations. Wea. Forecast-ing, 27, 1003–1016
http://dx.doi.org/10.1175/WAF-D-10-05000.1
Pu Z., Li X., Zipser E. J., 2009, Diagnosis of the initial and forecast errors in the numerical simulation of the rapid intensification of hurricane Emily (2005). Wea. Forecasting, 24, 1236–1251
http://dx.doi.org/10.1175/2009WAF2222195.1
Stewart S., 2004, Tropical Cyclone Report: Hurricane Ivan 2-24 September 2004, NHC tech-nical report, Miami FL, 44 pp.
Tartaglione C. A., Smith S. R., O’Brien J. J., 2003, ENSO impact on hurricane landfall prob-abilities for the Caribbean. J. Climate, 26, 2925–2931
http://dx.doi.org/10.1175/1520-0442(2003)016%3C2925:EIOHLP%3E2.0.CO;2
Tolman H. L., 2002, User manual and system documentation of WAVEWATCH-III version 2.22. NCEP Tech. Note, 139 pp
Tompkins C. F., Chiao S., 2012, Modeling Studies of Impacts from the Guinea Highlands in Relation to Tropical Cyclogenesis Along the West African Coast. Meteorology and At-mospheric Physics, in press. DOI: 10.1007/s00703-011-0167-3
http://dx.doi.org/10.1007/s00703-011-0167-3
Vizy E. K., Cook K. H., 2010, Influence of the Amazon/Orinoco Plume on the summertime Atlantic climate, J. Geophys. Res., 115, D21112, doi:10.1029/2010JD014049
http://dx.doi.org/10.1029/2010JD014049
Wang C., Enfield D. B., Lee S. K., Landsea C. W., 2006, Influences of the Atlantic warm pool on western hemisphere summer rainfall and Atlantic hurricanes. J. Climate, 19, 3011–3028


. PDF(2017KB)
. HTML
Associated material
. Readers' comments
Other articles by authors
. Sen Chiao
. Mark R. Jury
Related articles
. SST
. Ocean heat flux
. Rainfall
. Hurricanes
. WRF
Tools
. Email to a friend
. Post a comment