Research Article
Stock Differentiation of Goldband Goatfish Upeneus moluccensis from the Red Sea and the Mediterranean Sea Using Morphometric Analysis 
2 Flat Bush, Manukau, Auckland, New Zealand
3 Department of Animal Production, Faculty of Agriculture, Tishreen University, Syria
 Author
  Correspondence author
International Journal of Marine Science, 2017, Vol. 7, No. 5 doi: 10.5376/ijms.2017.07.0005
Received: 27 Dec., 2016 Accepted: 07 Feb., 2017 Published: 25 Feb., 2017
Pazhayamadom D.G., Jawad L.A., and Hassan M., 2017, Stock differentiation of goldband goatfish Upeneus moluccensis from the Red Sea and the Mediterranean Sea using morphometric analysis, International Journal of Marine Science, 7(5): 37-50 (doi: 10.5376/ijms.2017.07.0005)
The goldband goatfish Upeneus moluccensis is one of the several Lessepsian fish species that has migrated from Red Sea (original habitat) through Suez Canal and settled in the Mediterranean Sea (new habitat). The differences in environment may affect the phenotype of the fish species and thus the populations could evolve into distinct stocks unique to the habitats where they persist. The goatfish is now a commercially important fish species in both habitats though no studies have so far compared the morphology between these populations. Fish samples were collected from Hurghada (Egypt) and Latakia (Syria), one each from the Red Sea and the Mediterranean Sea respectively. We measured 14 morphometric distances from each fish specimen and they were transformed using an allometric approach to remove the effect of size from shape of the individual. The entire multivariate data was then subjected to principal component analysis to determine the shape differences between these populations. Our study showed significant differences in the body shape of the fish, mostly associated to their adaptations to swim and improve visibility at the respective environments. This indicates that the goatfish populations in the Red Sea and the Mediterranean Sea are two unique fish stocks.
Introduction
The Levantine, Aegean, Ionian and Adriatic Seas belong to the region of eastern Mediterranean Sea and this area is a remnant of the Tethys Ocean (Neev et al., 1985). The deep-water communication between the Mediterranean and the Indian Ocean was opened during the early Miocene (Robba, 1987) and sporadic marine contacts continued well into the Messinian period (Sonnenfeld, 1985) but the species of Indo-Pacific origin still inhabited the Pliocene Mediterranean (Sorbini, 1988). This area is now open to the Red Sea and Indian Ocean through the Suez Canal, which resulted in an ongoing ‘Lessepsian migration’ (the directional movement of marine organisms from The Red Sea to The Mediterranean Sea through the Suez canal) of marine fish species.
The eastern Mediterranean Sea region has faced two dramatic changes through its hydrological lifetime, the completion of the construction of the Suez Canal in 1869 and the fully operation of the Aswan High Dam in 1964 (Aleem, 1972; Golani, 1998). These constructions brought substantial changes in the marine ecosystem including the biota of the eastern Mediterranean region. The two regions that the Suez Canal separate differ in their temperature regimes where it is relatively stable in the Red Sea but with wider fluctuations in the Mediterranean Sea. The biota of both seas is different belonging to discrete zoogeographical regions i.e., tropical Indo-Pacific for the Red Sea and temperate Atlantic for the Mediterranean Sea (Golani, 1998).
The percentage of the fish Lessepsian migrants in the Mediterranean Sea is about 13.2% (Golani, 1996) but only a few have established populations (Golani, 1998). One among these populations is the goatfish of family Mullidae. Only two goatfish species have migrated and established in the new niches of the Mediterranean Sea (Goren and Dor, 1994) i.e., Upeneus moluccensis (Bleeker, 1855) and Upeneus pori (Ben-Tuvia and Golani, 1989). The golden-banded goatfish U. moluccensis is now a commercially important demersal fish species in the eastern Mediterranean Sea. It lives in shoals mostly in sandy-muddy or muddy habitats at depth between 20-130m (Kaya et al., 1999). The goatfish populations are fished by many countries among which is Egypt (in Red Sea) and Syria (in Mediterranean Sea) from where the samples for the present study have been examined. The data on landed catch of this species are not available in both Syrian and Egyptian coasts. However, the catch of this species has contributed substantially to the total marine fish landings in Syria (Saad, 2010). Whatever so, the total marine fish landings in Syrian coasts (from the Mediterranean Sea) have not exceeded more than 4000t for the last ten years.
Studies on genetic variability of U. moluccensis from the Red Sea and the eastern Mediterranean Sea (Golani and Ritte, 1999; Hassan and Bonhomme, 2005) have found no genetic differences between these populations. However, environmental factors such as water temperature, salinity, radiation, dissolved oxygen, water depth and current flow have shown to cause variation in the morphology of the fish (Vladykov, 1934; Smith, 1966; Turan, 2000) even when no apparent differences are observed in the genotype (Imre et al., 2002). Morphological features are continuous characters depicting the shape of the fish and hence their differences between populations remain to have a valuable tool in fish stock identification (Sajina et al., 2011a; 2011b; Pazhayamadom et al., 2015). Stable shape differences in fish groups may reveal differential growth, mortality or reproductive rates, which are parameters, used in many stock assessment models (Swain and Foote, 1999; Cadrin, 2000).
Fish stocks shown to be separated for a considerable period may show a notable morphological differentiation within a species and such information can be used to determine the boundaries of unique fish stocks (Sajina et al., 2011a; 2011b; Pazhayamadom et al., 2015). This information is important because it help us to understand their reproductive behaviour (spawning migrations), feeding behaviour (migrations for food) and ontogenetic development, thus explaining their connectivity between geographical habitats (Secor, 2004). Many analytical models assume a closed life cycle for fish stocks where the individuals belong to unique spawning component with homogenous vital rates. Therefore, ongoing management of exploited fish resources require information on the spatial structure of fish populations (Cadrin and Secor, 2009). Such information can assist with designing the sampling programs for population studies, developing management strategies and framing policies for long-term fisheries sustainability (Pazhayamadom et al., 2015). However, management practices with inadequate knowledge of the stock may bring substantial changes in the biology and productivity of fish populations (Altukhov, 1981; Ricker, 1981).
In this study, we use morphometric analysis to investigate the stock differences of U. moluccensis populations from two geographical regions i.e., the Red Sea and the Mediterranean Sea. Though the populations from both locations have historically originated from the same genotype, differences in morphology may indicate the existence of multiple fish stocks, particularly given the geographical separation and limited intermixing of individuals for spawning purposes. We collected measurements on morphometric distances and processed them using an allometric approach to remove the effect of size from shape of the fish. The resultant data was then analysed using PCA and pattern recognition techniques to determine whether the populations belong to two distinct fish stocks.
1 Materials and Methods
1.1 Sampling and data collection
A total of 100 specimens of U. moluccensis were collected from the catch landed by commercial fishing vessels, 50 each from the Red Sea coast at Hurghada, Egypt and the Mediterranean Sea coast at Latakia, Syria (January-February and July-August, 2000) (Figure 1). These specimens are the same specimens that Hassan and Bonhomme (2005) have collected. According to Reist’s recommendation (Reist, 1985), at least 25 animals should be used for morphological analysis and hence the number of samples was assumed to be sufficient to explore the differences between these populations. Bottom trawl net was used to catch the fish specimens at a depth range 10-120 m from both localities. Following capture, the samples were placed individually into plastic bags were kept deep-frozen (-20°C) until further analysis. The identification of the species was based on Uiblein and Gouws (2014; 2015), Uiblein and Heemstra (2010) and the features of the species were compared with the closely related species (Table 1). In the laboratory, the specimens were allowed to thaw and the morphometric measurements were measured using a digital caliper to the nearest 0.1 mm. A total of 14 morphometric distances were measured from each specimen (Figure 2) i.e., total length (TL), from the tip of the mouth to the posterior edge of the two lobes of the caudal fin; standard length (SL), from the tip of the mouth to the end of the vertebral column near the base of the caudal fin; head length (HL), from the tip of the mouth to the posterior edge of the operculum; head height (HH), the largest vertical distance of the head; snout length (SnL), from the tip of the mouth to the anterior edge of the eye; eye diameter (ED), the horizontal distance between the anterior and posterior edges of the eye; length of first dorsal fin (FDF), from the origin to the posterior end of the 1st dorsal fin; length of second dorsal fin (SDF), from the origin to the posterior end of the 2nd dorsal fin; pectoral fin length (PFL), from the base of the pectoral fin to the tip of the longest ray of the fin; pelvic fin length (PvFL), from the base of the pelvic fin to the tip of the longest ray of the fin; anal fin length (AFL), from the origin to the posterior end of the anal fin; caudal peduncle length (CPL), from the posterior end of the anal fin to the edge of the caudal fin; caudal peduncle depth (CPD), the vertical distance at the base of the caudal fin; body height (BH), the largest vertical distance of the fish body. The morphometric measurements are presented in Appendix 1. The specimens were dissected to determine the sex of the individual and this was based on the shape and appearance of gonads (Bowers, 1954). All the specimens collected were with well-developed gonads and the data collected are from mature individuals of the parent stock. There was no problem in the determination of the sex of the specimens.
|
Figure 1 Map showing the two sampling locations used in this study Source: GSHHS shoreline data plotted using PBS mapping R package |
.png)
|
Table 1 Comparison of Upeneus moluccensis and four closely related species based on some diagnostic characters of the species |
.png)
|
Figure 2 The morphometric distances measured on U.moluccensis (127 mm SL, Jizan, Saudi Arabia), courtesy of S. V. Bogorodsky |
.png)
|
Appendix 1 Morphometric characters of Upeneus moluccensis collected from the Mediterranean coasts of Syria and the Red Sea coasts of Egypt. TL, total length; SL, standard length; HL, head length; HH, head height; Anal, snout length; ED, eye diameter; FDF, 1st dorsal fin length; SDF, 2nd dorsal fin length; PvFL, pelvic fin length; PFL, pectoral fin length; AFL, anal fin length; CPL, caudal peduncle length, CPD, caudal peduncle depth; BH, Body height |
1.2 Transforming measurements to remove size dependent effects
All morphometric distances were first log transformed and tested for normality (Jolicoeur, 1963). The outliers in the morphometric data may distort the general tendency of the size distribution. Hence, all variables (distances) were tested for the presence of outliers using Cook’s distance estimates (Cox and Small, 1978). However, no observations were found significantly influential.
The overall variation of a morphometric distance is the compound effect of size and shape of the organism (Sajina et al., 2011a; 2011b; Pazhayamadom et al., 2015). Since all the morphometric distances measured in this study are linear in nature (thus giving high correlations with total length), it is important to remove the effect of size before subjecting them to statistical (multivariate) tests. For this, an allometric approach was followed (Equation 1) where the correlation of distances with size of the fish is reduced by converting them into size independent shape variables (Reist, 1985).
Mtrans = log M–β(log TL–log TLmean) (1)
Mtrans is the transformed morphometric distance, M is the original distance measured, TL is the total length of the fish, β is the within-group (location) slope of the regressions of log M on log TL and TLmean is the location-wise mean total length.
1.3 Statistical analysis
Correlation coefficients between the transformed distances (Mtrans) and the total length of the fish (TL) were estimated to validate the efficacy of allometric transformation i.e., of removing size dependent effects. Further, the Mtrans distances were subjected to principal component analysis (PCA), a dimension reduction technique where most variations in the data are reduced to a few principal components. The PCA was employed using the prcomp function in R statistical package (R Core Team, 2014). A scree plot was used to determine how many principal components should be retained to explain most of the shape variations between the two fish populations. Further, a scratching procedure as described by Hatcher (1994) was followed to identify distances that loaded heavily on each principal component. These distances (with high loadings) were considered to be influential because such information alone can classify the individuals to their respective populations or fish stocks.
A two-sample t-test was employed using the t-test function in R statistical package (R Core Team, 2014) to obtain quantitative information on these influential distances and to determine whether their means are significantly different between the Red Sea and Mediterranean Sea fish populations.
2 Results
The correlation between the transformed morphometric distances and total length were found non-significant (p>0.001), indicating that the effect of size has been successfully removed by performing the allometric transformation (Equation 1). The PCA on morphometric distances generated the proportion of variation explained by each principal component (PC). These proportions were assessed using a scree plot to determine the number of PCs that has to be retained for further evaluation and interpretation (Figure 3). The scree plot of these proportions indicates that the first three components are large enough to explain a cumulative of 69.22% of the total morphometric variation. However, only the first two components were considered in this study since the third component did not show any significant improvement with the separation of population clusters.
Differentiation of populations based on location and sex
The first principal component (PC1) explained 38% of the total morphometric variation (Figure 3) and loaded heavily on distances representing the tail (CPL and CPD) and eye (ED) of the fish (Table 2). The second principal component (PC2) explained 19% of the morphometric variation (Figure 3) and loaded heavily on distances representing the head (HL and HH) and snout of the fish (SnL, Table 2 and Table 3). A bivariate plot of PC1 vs. PC2 scores of all individuals showed that the samples from Red Sea and Mediterranean Sea are morphologically distinct giving two separate clusters (Figure 4a). Morphological analysis is also efficient to determine shape differences associated to sexual dimorphism of the species. However, no such differences (or clusters) were observed in our analysis when the PC scores of the two sexes were used in the bivariate plot (Figure 4b). Fish from the Medditerranean stock had smaller heads and snouts in relation to their bodies than those from the Red Sea.
|
Figure 3 Scree plot indicating the proportion of variation explained by each principal component in the PCA Note: The first two components cumulatively explained 57% of the total morphometric variation |
.png)
|
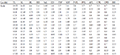
Table 2 The principal component (PC) scores generated for morphometric distances |
.png)
|
Table 3 The mean ± standard deviation of morphometric distances which gave high loadings on the principal components |
.png)
|
Figure 4 The bivariate plots of PC1 and PC2 from the Principal Component Analysis (a) plots showing the clusters based on sampling locations (b) plots showing the clusters based on sex of the individuals Note: The ellipses show the confidence limits with coverage of 90% of the observations in a subgroup |
.png)
The distances related to tail and eye (that loaded heavily on PC1) alone explained most of the shape differences in the morphology between the two populations. This can be attributed to an adaptation of locomotion and vision of the fishes, thus they may relate to the swimming or navigational abilities in their respective environments. The shape differences related to head and snout (that loaded heavily on PC2) are less significant when compared to those loaded on PC1, but can be attributed to their feeding adaptations in these environments. We discuss these inferences based on the differences in ecological environment of both habitats along with other evidences on the phenotypic plasticity of fish species.
3 Discussion
Our study detected significant shape difference among U. moluccensis populations of the Mediterranean Sea and the Red Sea. The detected pattern of phenotypic variation is probable given the geographic separation and the extent of fish migrations are concerned (Pazhayamadom et al., 2015). A study based on genetic data does not support the phenotypic differentiation of U. moluccensis observed in this study (Hassan and Bonhomme, 2005). However, phenotypic variations are not directly under genetic control but are sensitive to phenotypic plasticity (West-Eberhard, 1989). When compared to other vertebrates, fishes show greater variation in morphological traits and are vulnerable to environmentally induced differences through adaptations to feeding environments, prey types and food availability (Thompson, 1991; Wimberger, 1992). Many studies also show that environmental factors such as temperature, salinity, diet content or water velocity may determine the phenotypic differentiation in fish populations (Beacham, 1990; Wimberger, 1992; Pakkasmaa and Piironen, 2000; Mazzarella et al., 2015). Hence, morphological differences do not prove genetic distinctness between populations, but do suggest that the fishes in each group may not mix with those in other groups (Hassan and Bonhomme, 2005). Environmental conditions also cause ontogenetic changes in morphology (Cheverud, 1988) therefore phenotypic distinction could also indicate a sign of long separation between populations either in time, space or both (Pazhayamadom et al., 2015). Such findings are important in fisheries management because a lack of detectable genetic heterogeneity does not mean that self-recruiting fish stocks do not exist (Carvalho and Hauser, 1994). In the following sections, we discuss the phenotypic discreteness of U. moluccensis populations in relation to the environmental factors that persist in the habitats of Red Sea and the Mediterranean Sea.
Results indicated that one reason for morphometric differentiation between samples was the shape difference in length and depth of caudal peduncle. The shape difference in caudal peduncle is related to their swimming abilities and hence it is important to review the hydrological conditions where the fish live in. Researchers have found that the water turbulence in the Syrian coasts of the eastern Mediterranean Sea is considerably higher (Yolsal et al., 2007; Coppini et al., 2011) than the Egyptian coasts of the Red Sea (El Nemr et al. 2007; Dar and El-Saharty, 2013). A deeper caudal peduncle has been observed for fishes from turbulent waters (McLaughlin and Grant, 1994; Walker, 1997) in many studies. Therefore, the morphometric variation observed in the caudal peduncle could be a consequence of phenotypic plasticity in response to the ocean turbulence prevailing in these habitats, with a deeper caudal peduncle for specimens collected from the Mediterranean Sea (Table 2 and Table 3). An elongated and wide caudal peduncle maximizes the thrust and thus enhances the ability of fish to control its swimming process (McLaughlin and Noakes, 1998; Blake, 2004).
Results from our study also indicate that the eye diameter is greater for specimens collected from the Mediterranean Sea (Table 2). This is likely due to the effect of light intensity at the respective environments because fishes may reduce or devote more resources to eye if they grow in environments with low visibility (Pankhurst, 1987; 1989; Kotrschal et al., 1998; Remington, 2008). Many studies indicate that the turbidity of Mediterranean Sea is relatively higher when compared to the Red Sea (Lakkis and Novel-Lakkis, 1981; Riegl and Piller, 1999; Bianchi and Morri, 2000; Mansour et al., 2007). This likely resulted in reduced light intensity and thus hampering the vision of fish populations. Studies indicate that the allometry of eye diameter (positive or negative) generally depends on the behaviour and biology of the fish in the new environment (Remington, 2008; Dugas and Franssen, 2012). For example, the eyes may reduce or degenerate if they are no more useful for survival of the population (Jeffery, 2005). Similarly, the eye size may increase in a turbid environment if they form an integral part of the reproductive process such as nuptial colouration (Dugas and Franssen, 2012). Thus, the cause of positive allometry in eye diameter requires more insight into the behaviour of U. moluccensis, how they adapt in a turbid environment for growth, feeding and reproductive purposes so their life cycle can be completed.
Morphological adaptations may allow the organism to fully exploit their habitat in a marine ecosystem (Webb, 1984; Wainwright, 1996). However, such adaptations are sensitive to anthropological activities in the habitat such as the lakes and reservoir (Franssen, 2011), channelization (Scarnecchia, 1988), eutrophication (Seehausen, 2006) and overfishing (Levin et al., 2006). This may result in an ongoing change of the habitat and thus affecting the life history characteristics of the population. A few species may react fast through phenotypic plasticity (similar to the morphological divergence in this study) providing them an intrinsic capacity to survive in a changing environment. Habitats that change that change, but then remain consistent may cause genetic deviation among fish populations but morphological differences can provide early cues on their adaptations to the new environment. Though the present study included only one fish species, our findings and conclusion can be used as a guideline on determining the shape changes in other Lessepsian species that has migrated through Suez Canal and established populations in the Mediterranean Sea (Torcu and Mater, 2000).
Our study indicate that the populations of U. moluccensis in Red Sea and Mediterranean Sea are possibly two unique fish stocks. Stock assessments of these populations should be carried out independently to provide advice on fisheries management (Pazhayamadom et al., 2015). Future studies could improve the spatial resolution of sampling by including more number of locations from both habitats. To reduce observational errors, it is recommended to obtain samples directly from the habitat through research vessel surveys. This is also important for conducting stock assessments because illegal, unreported and unregulated commercial fishing activities are very common in these regions (Tesfamichael and Pitcher, 2007; Öztürk, 2015). Stock identification tools such as the fatty acid signatures, stable isotope indicators, otolith/ scale morphometry and parasite tagging are extremely useful for investigating the spatial stock structure of the fish populations (Cadrin et al., 2013). Such techniques can offer more insight into the dynamics of the fish stock, their migrations, intermixing of individuals and the environment in which the different life history stages of the organism develop or transform from juvenile to adult forms.
Authors’ contributions
All authors were equally contributed to the production of this paper.
Acknowledgments
We would like to thank Sergey Bogorodsky for giving us the permission to use the image of Upeneus moluccensis collected from Jizan, Saudi Arabia, Red Sea. Our thanks should also go to Mr. Joacim Näslund, Zoologihurst, Göteborgs Universitet, Göteborg, Sweden for editing the fish image with Photoshop.
Aleem A.A., 1972, Effect of river outflow management on marine life, Marine Biology 15, 200–208
https://doi.org/10.1007/BF00383550
Altukhov Y.P., 1981, The stock concept from the viewpoint of population genetics, Canadian Journal of Fisheries and Aquatic Science, 38: 1523–1538
https://doi.org/10.1139/f81-205
Beacham T.D., 1990, A genetic analysis of meristic and morphometric variation in chum salmon (Oncorhynchus keta) at three different temperatures, Canadian Journal of Zoology, 68: 225–229
https://doi.org/10.1139/z90-033
Ben-Tuvia A., and Golani D., 1989, A new species of goatfish (Mullidae) of the genus Upeneus from the Red Sea and the eastern Mediterranean, Israel Journal of Zoology, 36: 103-112
Bianchi C.N., and Morri C., 2000, Marine biodiversity of the Mediterranean Sea: situation, problems and prospects for future research, Marine Pollution Bulletin, 40: 367–376
https://doi.org/10.1016/S0025-326X(00)00027-8
Blake R.W., 2004, Fish functional design and swimming performance, Journal of Fish Biology, 65: 1193–1222
https://doi.org/10.1111/j.0022-1112.2004.00568.x
Bowers A.B., 1954, Breeding and growth of whiting (Gadus merlangus L.) in Isle of Man waters, Journal of Marine Biological Association of United Kingdom 33, 97–122
https://doi.org/10.1017/S0025315400003507
Cadrin S.X., 2000, Advances in morphometric identification of fishery stocks, Review of Fish Biology and Fisheries, 10: 91–112
https://doi.org/10.1023/A:1008939104413
Cadrin S.X., Kerr L.A., and Mariani S., 2013, Stock identification methods: applications in fishery science, Elsevier, London
PMid:23449973 PMCid:PMC3630871
Cadrin S.X., and Secor D.H., 2009, Accounting for spatial population structure in stock assessment: past, present, and future. In: Beamish RJ, Rothschild BJ (eds) The future of fisheries science in North America, Springer, Netherlands pp 405–426
https://doi.org/10.1007/978-1-4020-9210-7_22
Carvalho G.R., and Hauser L., 1994, Molecular genetics and the stock concept in fisheries, Review of Fish Biology and Fisheries, 4: 326–350
https://doi.org/10.1007/BF00042908
Cheverud J.M., 1988, A comparison of genetic and phenotypic correlations. Evolution, 42: 958–968
https://doi.org/10.2307/2408911
Coppini G., De Dominicis M., Zodiatis G., Lardner R., Pinardi N., Santoleri R., Colella S., Bignami F., Hayes D.R., and Soloviev D., 2011, Hindcast of oil-spill pollution during the Lebanon crisis in the Eastern Mediterranean, July–August 2006, Marine Pollution Bulletin, 62: 140–153
https://doi.org/10.1016/j.marpolbul.2010.08.021
PMid:20880556
Cox D.R., and Small N.J.H., 1978, Testing multivariate normality, Biometrika, 65: 263–272
https://doi.org/10.1093/biomet/65.2.263
Dar M.A.R., and El-Saharty A.A., 2013, Some radioactive-elements in the coastal sediments of the Mediterranean Sea, Radiation Protection Dosimetry, 153: 361–368
https://doi.org/10.1093/rpd/ncs104
PMid:22719046
Dugas M.B., and Franssen N.R., 2012, Red shiners (Cyprinella lutrensis) have larger eyes in turbid habitats, Canadian Journal of Zoology, 90: 1431–1436
https://doi.org/10.1139/cjz-2012-0192
El Nemr A.M., El Sikaily A., and Khaled A., 2007, Total and leachable heavy metals in muddy and sandy sediments of Egyptian coast along Mediterranean Sea, Environment Monitoring Assessment, 129: 151–168
https://doi.org/10.1007/s10661-006-9349-8
PMid:17057978
Franssen N.R., 2011, Anthropogenic habitat alteration induces rapid morphological divergence in a native stream fish, Evolutionary Application, 4: 791–804
https://doi.org/10.1111/j.1752-4571.2011.00200.x
PMid:25568023 PMCid:PMC3352545
Golani D., 1998, Impact of Red Sea fish migrants through the Suez Canal on the aquatic environment of the Eastern Mediterranean, Bulletin of Yale School of Forestry and Environment Studies, 103: 375–387
Golani D., 1996, The marine ichthyofauna of the Eastern Levant—history, inventory, and characterization, Israel Journal of Zoology, 42: 15–55
Goren M., and Dor M., 1994, An updated ckeck-list of the fishes of the red sea CLOFRES II, The Israel academy of sciences and humanities, Jerusalem and interuniversity institute for marine sciences, Elat
Golani D., and Ritte U., 1999, Genetic relationship in goatfishes (Mullidae: Perciformes) of the Red Sea and the Mediterranean, with remarks on Suez Canal migrants, Scientia Marina, 63: 129–135
https://doi.org/10.3989/scimar.1999.63n2129
Hassan M., and Bonhomme F., 2005, No reduction in neutral variability of mitochondrial and nuclear genes for a Lessepsian migrant, Upeneus moluccensis, Journal of Fish Biology, 66: 865–870
https://doi.org/10.1111/j.0022-1112.2005.00643.x
Hatcher L., 1994, A step-by-step approach to using the SAS system for factor analysis and structural equation modelling, SAS Institute Inc. Cary, NC
Imre I., McLaughlin R.L., and Noakes D.L.G., 2002, Phenotypic plasticity in brook charr: changes in caudal fin induced by water flow, Journal of Fish Biology, 61: 1171–1181
https://doi.org/10.1111/j.1095-8649.2002.tb02463.x
Jeffery W.R., 2005, Adaptive evolution of eye degeneration in the Mexican blind cavefish, Journal of Heredity, 96: 185–196
https://doi.org/10.1093/jhered/esi028
PMid:15653557
Jolicoeur P., 1963, The multivariate generalization of the allometry equation, Biometrics, 19: 497–499
https://doi.org/10.2307/2527939
Kaya M., Benli H.A., Katagan T., and Ozaydin O., 1999, Age, growth, sex-ratio, spawning season and food of golden banded goatfish, Upeneus moluccensis Bleeker (1855) from the Mediterranean and south Aegean Sea coasts of Turkey, Fisheries Research, 41: 317–328
https://doi.org/10.1016/S0165-7836(99)00027-2
Kotrschal K., Van Staaden M..J., and Huber R., 1998, Fish Brains: Evolution and Environmental Relationships, Review of Fish Biology and Fisheries, 8: 373–408
https://doi.org/10.1023/A:1008839605380
Lakkis S., and Novel-Lakkis V., 1981, Composition, annual cycle and species diversity of the phytoplankton in Lebanese coastal water, Journal of Plankton Research, 3: 123–136
https://doi.org/10.1093/plankt/3.1.123
Levin P.S., Holmes E.E., Piner K.R., and Harvey C.J., 2006, Shifts in a Pacific Ocean fish assemblage: the potential influence of exploitation, Conservation Biology, 20: 1181–1190
https://doi.org/10.1111/j.1523-1739.2006.00400.x
PMid:16922234
McLaughlin R.L., and Grant J.W.A., 1994, Morphological and behavioural differences among recently-emerged brook charr, Salvelinus fontinalis, foraging in slow-vs fast-running water, Environmental Biology of Fishes, 39: 289–300
https://doi.org/10.1007/BF00005130
McLaughlin R.L., and Noakes D.L.G., 1998, Going against the flow: an examination of the propulsive movements made by young brook trout in streams, Canadian Journal of Fish Aquatic Science, 55: 853–860
https://doi.org/10.1139/f97-308
Mansour A.M., Mohamed A.W., El Dien G.K., and Sayed S.M., 2007, Sedimentological and environmental impacts of development projects along the coast of Hurghada, Red sea, Egypt, Egypt Journal of Aquatic Research, 33: 59–84
Mazzarella A.B., Voje K.L., Hansson T.H., Taugbøl A., and Fischer B., 2015, Strong and parallel salinity-induced phenotypic plasticity in one generation of threespine stickleback, Journal of Evolutionary Biology, 28: 667–677
https://doi.org/10.1111/jeb.12597
PMid:25656304
Neev D., Greenfield L., and Hall J.K., 1985, Slice tectonics in the eastern Mediterranean basin, In: Stanley DJ, Wezel FC (eds) Geological Evolution of the Mediterranean Basin, Springer pp.249–269
https://doi.org/10.1007/978-1-4613-8572-1_12
Öztürk B., 2015, Nature and extent of the Illegal, Unreported and Unregulated (IUU) fishing in the Mediterranean Sea, Journal of Black Sea/Mediterranean Environment, 21: 67–91
Pankhurst N.W., 1987, Intra-and interspecific changes in retinal morphology among mesopelagic and demersal teleosts from the slope waters of New Zealand, Environmental Biology of Fishes, 19: 269–280
https://doi.org/10.1007/BF00003228
Pankhurst N.W., 1989, The relationship of ocular morphology to feeding modes and activity periods in shallow marine teleosts from New Zealand, Environmental Biology of Fishes, 26: 201–211
https://doi.org/10.1007/BF00004816
Pakkasmaa S., and Piironen J., 2000, Water velocity shapes juvenile salmonids, Evolutionary Ecology, 14: 721–730
https://doi.org/10.1023/A:1011691810801
Pazhayamadom D.G., Chakraborty S.K., Jaiswar A.K., Sudheesan D., Sajina A.M., and Jahageerdar S., 2015, Stock structure analysis of “Bombay duck” (Harpadon nehereus Hamilton, 1822 ) along the Indian coast using truss network morphometrics, Journal of Applied Ichthyology, 31: 37–44
https://doi.org/10.1111/jai.12629
R Core Team, 2014, R: A language and environment for statistical computing. R Foundation for Statistical Computing, Vienna, Austria, URL http://www.R-project.org/
Reist J.D., 1985, An empirical evaluation of several univariate methods that adjust for size variation in morphometric data, Canadian Journal of Zoology, 63: 1429–1439
https://doi.org/10.1139/z85-213
Remington R.K., 2008, Ecology and evolution of turbid water adaptations in fishes. PhD dissertation, University of Oklahoma, Norman
Ricker W.E., 1981, Changes in the average size and average age of Pacific salmon, Canadian Journal of Fisheries and Aquatic Science, 38: 1636–1656
https://doi.org/10.1139/f81-213
Riegl B. and Piller W.E., 1999, Coral frameworks revisited–reefs and coral carpets in the northern Red Sea, Coral Reefs, 18: 241–253
https://doi.org/10.1007/s003380050188
Robba E., 1987, The final occlusion of Tethys: its bearing on Mediterranean benthic molluscs, In: McKenzie KG (ed) International symposium on Shallow Tethys 2, Balkema, Rotterdam, pp.405–426
PMCid:PMC1261835
Saad A., 2010, The fisheries and aquaculture in Syria, status and development perspective in Syria, Syrian Economic Bulletin, 1: 113-136 (in Arabic)
Sajina A.M., Chakraborty S.K., Jaiswar A.K., Pazhayamadom D.G., and Sudheesan D., 2011a, Stock structure analysis of Megalaspis cordyla (Linnaeus, 1758) along the Indian coast based on truss network analysis, Fisheries Research, 10: 100–105
https://doi.org/10.1016/j.fishres.2010.12.006
Sajina A.M., Chakraborty S.K., Jaiswar A.K., Pazhayamadom D.G., and Sudheesan D., 2011b, Stock structure analysis of Indian Mackerel, Rastrelliger kanagurta (Cuvier, 1816) along the Indian Coast. Asian Fisheries Science, 24: 331–342
Scarnecchia D.L., 1988, The importance of streamlining in influencing fish community structure in channelized a,d unchannelized reaches of a prairie stream, Regulatory Rivers Research and Management, 2: 155–166
https://doi.org/10.1002/rrr.3450020209
Secor D.H., 2004, Fish migration and the unit stock: three formative debates, In: Cadrin SX, Friedland KD, Waldman JR (eds) Stock identification methods: Applications in fishery science, Elsevier, Burlington USA, pp.17–44
Seehausen O., 2006, Conservation: losing biodiversity by reverse speciation, Current Biology, 16: R334–R337
https://doi.org/10.1016/j.cub.2006.03.080
PMid:16682344
Smith G.R., 1966, Distribution and evolution of the North American catostomid fishes of the subgenus Pantosteus, genus Castostomus, Misc Pub 129, Museum of Zoology, University of Michigan
Sonnenfeld P., 1985, Models of upper Miocene evaporite genesis in the Mediterranean region, In: Stanley DJ, Wezel FC (eds) Geological Evolution of the Mediterranean Basin, Springer, pp 323–346
https://doi.org/10.1007/978-1-4613-8572-1_16
Sorbini L., 1988, Biogeography and climatology of Pliocene and Messinian fossil fish of Eastern Central Italy, Bollettino del Museo civico di storia naturale di Verona, 14: 1–85
Swain D.P., and Foote C.J., 1999, Stocks and chameleons: the use of phenotypic variation in stock identification, Fisheries Research 43: 113–128
https://doi.org/10.1016/S0165-7836(99)00069-7
Tesfamichael D., and Pitcher T.J., 2007, Estimating the unreported catch of Eritrean Red Sea fisheries, African Journal of Marine Science, 29, 55–63
https://doi.org/10.2989/AJMS.2007.29.1.5.70
Thompson J.D., 1991, Phenotypic plasticity as a component of evolutionary change, Trends in Ecology and Evolution 6, 246–249
https://doi.org/10.1016/0169-5347(91)90070-E
Torcu H., and Mater S., 2000, Lessepsian fishes spreading along the coasts of the Mediterranean and the Southern Aegean Sea of Turkey, Turkish Journal of Zoology, 24:139–148
Turan C., 2000, Otolith shape and meristic analysis of herring (Clupea harengus) in the North-East Atlantic, Archive of Fishery and Marine Research, 48: 213–225
Uiblein F., and Gouws G., 2014, A new goatfish species of the genus Upeneus (Mullidae) based on molecular and morphological screening and subsequent taxonomic analysis, Marine Biology Research, 10: 655-681
https://doi.org/10.1080/17451000.2013.850515
Uiblein F., and Gouws G., 2015, Distinction and relatedness–Taxonomic and genetic studies reveal a new species group of goatfishes (Upeneus; Mullidae), Marine Biology Research, 11: 1021-1042
https://doi.org/10.1080/17451000.2015.1064963
Uiblein F., and Heemstra P.C., 2010, A taxonomic review of the Western Indian goatfishes of the genus Upeneus (Family Mullidae) with descriptions of four new species, Smithiana Bulletin, 11: 35-71
Vladykov V.D., 1934, Environmental and taxonomic characters of fishes, Transaction of the Royal Canadian Institute, 20: 99–140
Wainwright P.C., 1996, Ecological explanation through functional morphology: the feeding biology of sunfishes, Ecology, 77(5): 1336–1343
https://doi.org/10.2307/2265531
Walker J.A., 1997, Ecological morphology of lacustrine threespine stickleback Gasterosteus aculeatus L. (Gasterosteidae) body shape, Biological Journal of the Linnean Society, 61: 3–50
https://doi.org/10.1111/j.1095-8312.1997.tb01777.x
https://doi.org/10.1006/bijl.1996.9999
Webb P.W., 1984, Form and function in fish swimming, Scientific American, 251: 72–82
https://doi.org/10.1038/scientificamerican0784-72
Wimberger P.H., 1992, Plasticity of fish body shape. The effects of diet, development, family and age in two species of Geophagus (Pisces: Cichlidae), Biological Journal of the Linnean Society, 45: 197–218
https://doi.org/10.1111/j.1095-8312.1992.tb00640.x
West-Eberhard M.J., 1989, Phenotypic plasticity and the origins of diversity, Annual review of Ecology and Systematics, 20: 249-278
https://doi.org/10.1146/annurev.es.20.110189.001341
https://doi.org/10.1146/annurev.ecolsys.20.1.249
Yolsal S., Taymaz T., and Yalçiner A.C., 2007, Understanding tsunamis, potential source regions and tsunami-prone mechanisms in the Eastern Mediterranean, Geological Society, London, Special Publication, 291: 201–230


. PDF(1070KB)
. FPDF(win)
. HTML
. Online fPDF
Associated material
. Readers' comments
Other articles by authors
. Deepak G. Pazhayamadom
. Laith A. Jawad
. Mohamad Hassan
Related articles
. Morphometry
. Phenotypic plasticity
. Goatfish
. Caudal peduncle
. Eye diameter
Tools
. Email to a friend
. Post a comment