Research Article
Applied Heavy Metals Pollution Index (HPI) as a Water Pollution Indicator of Shatt Al-Arab River, Basrah-Iraq 
2 College of Marine Science, University of Basrah, Iraq
 Author
  Correspondence author
International Journal of Marine Science, 2017, Vol. 7, No. 35 doi: 10.5376/ijms.2017.07.0035
Received: 08 Aug., 2017 Accepted: 29 Aug., 2017 Published: 09 Sep., 2017
Al-Hejuje M.M., Hussain N.A., and Al-Saad H.T., 2017, Applied heavy metals pollution index (HPI) as a water pollution indicator of Shatt Al-Arab river, Basrah-Iraq, International Journal of Marine Science, 7(35): 353-360 (doi: 10.5376/ijms.2017.07.0035)
Five stations were selected at the middle part of Shatt Al-Arab river to determine the monthly variation of seven eco-toxic elements (Cd+2, Cu+2, Fe+2, Mn+2, Ni+2, Pb+2 and Zn+2) concentrations and their distribution as dissolved and particulate (exchangeable and residual) phases during the low tide period from December, 2012 to November, 2013. Heavy Metals Pollution Index (HPI) was applied to determine the pollution of Shatt Al-Arab water. Results showed that the concentrations of the previous metals as dissolved phase were (3.01; 2.35; 89.45; 4.48; 9.51; 43.67 and 7.58) µg/l, respectively, whereas in the exchangeable phase of particulate were (48.56; 53.22; 8968.76; 1748.58; 120.14; 271.52; 243.16) µg/g dry weight respectively and in the residual phase of particulate were (57.59; 88.68; 21571.74; 365.90; 163.39; 388.44 and 219.42) µg/g dry weight respectively. The results indicated that mean HPI values were found to be above the critical pollution index value of 100. HPI values for the presence study were ranged from 130.41 to 196.97 referred to polluted water caused by the world impermissible values of dissolved Pb, Fe and Cd.
Introduction
Heavy metals is a term generally taken to include the metallic elements with an atomic weight greater than 40, which have specific gravity greater than 5 g/cm3, but excluding the alkaline earth metals, alkali metals, lanthanides and actinides. All heavy metals exist in surface waters in colloidal, particulate, and dissolved phases. The dissolved metals have size below 0.45 µm and found as free ions or unionized organometallic chelates or complexes, or as colloids.
Heavy metals are among the most common environmental pollutants because of their toxicity, persistence and non-degradability in the environment (Majhi and Biswal, 2016), and their occurrence in water and biota indicate the presence of natural or anthropogenic sources (Balakrishnan and Ramu, 2016). Industrial processes, domestic sewages, agricultural fertilizers are the main source of metal pollution. In addition, metallic compounds are used as pigments in paint and dye manufacture, plastic, rubber, and paper; and many others. The prevalence of heavy metals in domestic formulations, such as cosmetic or cleansing agents, is frequently overlooked. Some forms of intensive agriculture give rise to severe metal pollution (Abel, 2002). The partitioning of metals between dissolved and suspended particulate matter determines their ultimate fate in the aquatic environment (Al-Khafaji et al., 2011).
The most important heavy metals from the point of view of water pollution are lead, cadmium, iron, zinc, copper, nickel and manganese. Some of these metals (e.g. copper, zinc and iron) are essential trace elements to living organisms and play an important roles in the functioning of critical enzyme systems, but become toxic at higher concentrations. Others, such as lead and cadmium, have no known biological function, and may be toxic even at trace levels to exposure (Al-Hejuje, 2014). Heavy metal exposure causes serious health problems, including reduced growth and development, cancer, organ damage, nervous system damage, and in extreme cases death (Alani et al., 2014). Heavy metals, like Cd and Pb are toxic even at low concentrations, can bio-accumulated and biomagnificated through the food chain and are not degradable by decomposers organisms (Al-Hejuje, 1997).
In future to protect water bodies from pollution, continuous monitoring is necessary to avoid further pollution. For water bodies it is necessary to find out some pollution monitoring tools (Chougule et al., 2009; Yankey et al., 2013). Heavy metal pollution indices are a useful and a relatively easy way to assess the composite of overall heavy metal pollution (Al-Hejuje, 2014). Several methods have been previously proposed such HPI: heavy metals pollution index (Mohan et al., 1996), MPI: metal pollution index (Meybeck et al., 2004), and HEI: heavy metal evaluation index (Bhuiyan et al., 2010) to calculate the overall water pollution with heavy metals. The heavy metal pollution index (HPI) is a method of rating that shows the composite influence of individual heavy metal on the overall quality of water (Reza and Singh, 2010; Balakrishnan and Ramu, 2016).
The main goal of the present study is to determine the temporal and spatial variations of heavy metals at the Shatt Al-Arab River, and also apply HPI as an effective tool to assess the water pollution with heavy metals and it's suitability for different purposes. HPI describes as a bridge between professionals and laymen or the decision makers.
1 Materials and Methods
Water sample (5 L) were collected from each of five stations along the middle part of Shatt Al-Arab river, Southern of Iraq during Dec., 2012 -Nov., 2013 period at the following coordinates: 30.36 623 N and 47.45 662 E (station 1); 30.34 915 N and 47.46 368 E (station 2); 30.33 755 N and 47.47 563 E (station 3); 30.30 376 N and 47.51 328 E (station 4); and 30.27 251 N and 48.02 810 E (station 5). Water samples were collected at least 20 -30 cm under the water surface at the middle of the river using polyethylene bottles and preserved cooling until reach the lab.
In the laboratory, water samples (5 L) were filtered as soon as possible through pre-washed (HCl 0.5 N) and pre-weighted Millipore membrane filters (0.45 µm pore size). The filtrate was considered as dissolved phase, while those retained on the surface of filters were considered as particulate phase. The filtrate was then pre-concentrated using chelating ion exchange resin (Purolite-C-100 resin in hydrogen form); about 5 L of filtrate was pass through activated ion exchange column with a flow rate of about 8 ml/min. The column was then washed with 100 ml of deionized water and the bounded heavy metals were eluted using 50 mL of HNO3 (2 N). The elutes were collected in 100 ml clean Polyethylene Tri Fluro Ethane (PTFE) containers ,allowed on hot plate at 70°C until the sample volume reduced below 25 ml. The sample volume was up to 25 mL mark with deionized water and stored in tightly stopper polyethylene vials ready for analysis of the metals using flame atomic absorption spectrophotometer (FAAS).
The filters were dried in oven at 60°C to constant weights and their weights recorded to obtain the values of the total suspended matter. The exchangeable heavy metals were extracted using 30 ml HCl (0.5 N) overnight in an orbital shaker with 300 rpm. The solution was centrifuged at 5000 rpm for 20 minute, then the supernatant was filtered using pre-cleaned filter paper (Watman No. 1) to remove some of the suspended matters. The filtrate was decanted and stored in tightly stopper polyethylene vials to be ready for analysis (Chester and Voutsinou, 1981).
The metals in residual phase of the particulate matter was extracted according to Sturgeon, et al. (1982), where the above mentioned steps was washed by 40 mL deionized water, centrifuge for 20 minutes. Then samples were digested with 5 mL concentrated HNO3 acid in PTFE vessels at 70°C on hot plate near dryness state. The digestion was further proceeded with 1:1 mixture of concentrated HClO4 and HF acids. The residue was dissolved in 30 mL of HCl (0.5 N), allowed on hot plate at 70°C, then made up to 30 mL with deionized water ,and filtered using pre-cleaned filter paper (Watman No. 1). The samples were stored in tightly stopper polyethylene vials to be ready for analysis by FAAS.
1.1 Heavy metal pollution index (HPI)
The Heavy Metal Pollution Index (HPI) is a method of rating that shows the composite influence of individual heavy metal on the overall quality of water (Reza and Singh, 2010). HPI in water was developed by assigning weight or rating (Wi) for each selected element. The weighing value was between zero and one, reflecting the relative importance of individual quality considerations.

Where Wi is the unit of weightage, k is the constant of proportionality (k=1), and Si is the recommended standard for ith parameter.
The sub index (Qi) of the ith parameter was calculated according to Reza and Singh (2010):
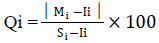
Where Mi is the monitored value of heavy metal of ith parameter in µg/l, Ii is the maximum desirable value (ideal) of ith parameter, Si refers to the standard or permissible limit for ith parameter.
The HPI model (Mohan et al., 1996) was calculated as:
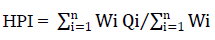
Critical pollution index value is 100. The higher HPI value causes the greater damage to health.
1.2 Statistical analysis
Analysis Of Variance was applied by Minitab ver.16 software and Relative Least Significant Differences (RLSD) values were calculated to identify the existence of temporal and spatial significant differences. Principal Components Analysis (PCA) was done using Canoco ver.4.53 in order to get an overall assessment of the possible relations among environmental variables.
2 Results and Discussion
During visitation to the area, people were seen washing their cars, washing sheep and cattle in Shatt Al-Arab River, irrigating their farms with the polluted water. Hence, consumers of milk, meat products, and vegetables may be at risk of chemical poisoning and health complications arising from the dangerous metals pollutants.
The metal speciation (dissolved, particulate) can provide informations about the complex interactions among components in an aquatic environment.
The concentrations of cadmium in dissolved phase ranged from (2.88 µg/L) at station 5 to (3.08 µg/L) at station 2 (Table 1). Whereas in particulate phase, the concentrations in the exchangeable phase ranged from (28.42 µg/g dry weight) at station 5 to (56.47 µg/g dry weight) at station 4, the residual phase of particulate ranged from (31.93 µg/g dry weight) at station 5 to (69.64 µg/g dry weight) at station 4. Relative Least Significant Differences showed non-significant differences (P>0.05) were found among the cadmium concentrations (as dissolve or as particulate) at different stations.
Copper concentrations as dissolved ranged from (2.14 µg/L) at station 5 to (2.58 µg/L) at station 1 (Table 1). Non-significant differences (P>0.05) were found among the concentrations at different stations. While in particulate phase, the concentrations in the exchangeable phase ranged from (22.74 µg/g dry weight) at station 5 to (67.10 µg/g dry weight) at station 1, and significant differences (P<0.01) were found among the concentrations at different stations. The copper concentrations in the residual phase of particulate ranged from (60.80 µg/g dry weight) at station 5 to (107.60 µg/g dry weight) at station 1, and non-significant differences (P>0.05) were found among the residual concentrations at different stations.
|
Table 1 The concentrations of heavy elements in dissolved and particulate phases at the studied stations during the studied periods Note: mean ± Standard deviation (SD) |
.png)
The concentrations of iron in dissolved phase ranged from (41.75 µg/L) at station 5 to (145.68 µg/L) at station 1 (Table 1). Significant differences (P<0.01) were found among the concentrations at different stations. In the exchangeable phase of particulate the concentration ranged from (6111.0 µg/g dry weight) at station 5 to (10107.0 µg/g dry weight) at station 3. In the residual phase of particulate ranged from (18428.0 µg/g dry weight) at station 5 to (24181.0 µg/g dry weight) at station 2. Non-significant differences (P>0.05) were found among the concentrations of iron in the exchangeable or residual phases of particulate at different stations.
The concentrations of manganese in dissolved phase ranged from (3.97 µg/L) at station 5 to (4.98 µg/L) at station 1 (Table 1). Non-significant differences (P>0.05) were found among the dissolved concentrations at different stations. In particulate phase, the concentrations in the exchangeable phase ranged from (954.1 µg/g dry weight) at station 5 to (2396.5 µg/g dry weight) at station 4. Significant differences (P<0.01) were found among the concentrations at different stations. In the residual phase of the particulate ranged from (325.2 µg/g dry weight) at station 5 to (423.3 µg/g dry weight) at station 1. Non-significant differences (P>0.05) were found among the residual concentrations at different stations.
Nickel concentration in the dissolved phase ranged from (8.39 µg/L) at station 5 to (10.45 µg/L) at station 1 (Table 1). In particulate phase, the concentrations in the exchangeable phase ranged from (81.99 µg/g dry weight) at station 5 to (135.17 µg/g dry weight) at station 3. The nickel concentrations in the residual phase of particulate ranged from (126.49 µg/g dry weight) at station 4 to (194.83 µg/g dry weight) at station 1. Non-significant differences (P>0.05) were found among the concentrations of nickel (as dissolve or as particulate) at different stations.
The concentrations of lead in dissolved phase ranged from (40.91 µg/L) at station 3 to (46.55 µg/L) at station 2 (Table 1). Non-significant differences (P>0.05) were found among the dissolved concentrations at different stations. In particulate phase, the concentrations in the exchangeable phase ranged from (144.6 µg/g dry weight) at station 5 to (321.1 µg/g dry weight) at station 4. Significant differences (P<0.05) were found among the concentrations at different stations, while in the residual phase of particulate ranged from (159.8 µg/g dry weight) at station to (509.3 µg/g dry weight) at station 4. Non-significant differences (P>0.05) were found among the residual concentrations at different stations.
The concentrations of zinc in dissolved phase ranged from (5.43µg/L) at station 5 to (9.65 µg/L) at station 4 (Table 1). Non-significant differences (P>0.05) were found among the dissolved concentrations at different stations. In particulate phase, the concentrations in the exchangeable phase ranged from (107.0 µg/g dry weight) at station 5 to (385.3 µg/g dry weight) at station 2. Significant differences (P<0.01) were found among the concentrations at different stations, whereas in the residual phase of particulate ranged from (127.4 µg/g dry weight) at station 5 to (254.2 µg/g dry weight) at station 4 and non-significant differences (P>0.05) were found among the concentrations at different stations.
In the present study the concentrations of Pb, Cd and Fe in dissolved phase at most stations exceeded the highest permissible limits of drinking water, and this finding was in agreement with Al-Saffie (2005) who found elevated in Pb concentrations at Shatt Al-Arab river and Hassan (2007) who found elevation in Cd and Pb concentrations at Shatt Al-Arab river. The concentrations of other metals (Ni, Mn, Cu, and Zn) were below the permissible limits of drinking water according to the WHO (2011) (Table 2). The present finding was in agreement with Mastoi et al. (2008) who found that the main source of high level of Cd in water is the runoff from the agricultural fields rich in chemical fertilizers. The spatial elevated concentrations could be related to land-based point source discharges caused by rapid urbanization and economic development in Basrah city center, this finding was in agreement with Al-Hejuje (1997) and Zhang et al. (2009), or may be due to a wide range of anthropogenic impacts linked to variations in population density, wastewater discharges and industrial activities. The river is extensively used for washing vehicle and the wastewater is drained back into the river, the vehicle emission which can travel for a long distance from the source of emission by atmospheric transport, traffic sources, and cities are the main sources of contaminations of heavy metals in the river (Song et al., 2010; Manoj et al., 2012). The fluctuation in the concentrations of heavy metals could be attributed to the interactions between multi factors that affect the concentrations of dissolved metals, such as the unequal amount s of sewage discharged, the phytoplankton and aquatic plants densities which absorbed or adsorbed the ionic metals, the sand storms occurring, and the fuel burn emissions specially during Summer as a result of electrical power generation machines that released large amounts of metals, especially lead compounds, into the river.
|
Table 2 The World and the Iraqi Permissible values for heavy metals in water as compared with the present study |
.png)
The mean concentrations of all the studied heavy metals in particulate phase were higher than those in dissolved phase. This finding was in agreement with Al-Khafaji (1996); Al-Hejuje (1997) and Hassan et al. (2010). Most of heavy metals in particulate phase positively correlated with those in dissolved phase and this could be attributed to the same sources and the ability of suspended particulate to accumulate these metals from the surrounding water. Suspended solid is the same as the sediments that can scavenge and enrich the metals input into water (Song et al., 2010). This could be attributed to the ability of the particulate matter (especially the living phytoplankton) to concentrate the heavy elements in their bodies, or may be due to the considerable variations in partitioning between water and particulate matter. However, the concentrations of heavy metals in particulate matter mostly depend on many factors such as wastewater discharge, seasonal loads and the nature of basin .Also, sewage and seepage from agricultural lands, the disposal of industrial and municipal effluent could change the concentrations of heavy metals in the particulate matters (Taobi et al., 2000).
3 The Heavy Metals Pollution Index (HPI)
The lowest mean value of HPI (130.41) was found at station 5 in summer, while the highest mean value (196.97) was found at station 1 in winter (Table 3). ANOVA test showed non-significant differences (P>0.05) were found among stations or among seasons. Generally, the water was polluted with heavy metals along the studied period at all the studied stations. This could be attributed to high concentrations of Pb, Cd, and Fe in dissolved phase which exceeded the permissible limits in drinking water, and the low concentrations of Cu, Mn and Zn which were below the permissible limits.
|
Table 3 The HPI values and the water pollution descriptions at the studied stations during the studied periods Note: ∑ Wi= 0.493452 |
.png)
High positive correlation between HPI and its correlated metals is illustrated in Figure 1.
|
Figure 1 The Principal Components Analysis (PCA) between HPI and its correlated heavy metals |
.png)
4 Conclusion
In the present study, the mean heavy metal pollution index (HPI) of Shatt Al-Arab River were found above the critical index value 100, according to impermissible values of dissolved Pb, Fe and Cd. which indicates that are represented as surface water pollution with respect to heavy metals.
Authors’ contributions
Conceived and designed the experiments: AL-Saad H.T., Al-Hejuje M. and Hussain N. Analysed the data: Al-Hejuje M. Wrote the first draft of the manuscript: Al-Hejuje M. Contributed to the writing of the manuscript: AL-Saad H.T., Al-Hejuje M. and Hussain N. Agree with manuscript results and conclusions: AL-Saad H.T., Al-Hejuje M. and Hussain N. Jointly developed the structure and arguments for the paper: AL-Saad H.T., Al-Hejuje M. and Hussain N. Made critical revisions and approved final version: Al-Hejuje M., AL-Saad H.T. and Hussain N. authors reviewed and approved of the final manuscript.
Acknowledgments
The researchers wish to acknowledge the Marine Science Center (University of Basra) for providing laboratory facilities.
Abel P.D., 2002, “Water Pollution Biology”, 2nd ed., Copyright ©Taylor & Francis
Alani R., Alo B., and Ukoakonam F., 2014, Preliminary investigation of the state of pollution of Ogun River at Kara Abattori, near Berger, Lagos, Inter. J.Envir. Sci. Toxicol. 2(2): 11-23
Al-Hejuje M.M., 1997, Distribution of heavy elements in water and sediments from Al-Ashar and Al-Khandak canals connected with Shatt–Al-Arab River and their effects on Algae, M.Sc. Thesis, University of Basrah, college of science, Biology Department, pp.104
Al-Hejuje M.M., 2014, Application of water quality and pollution indices to evaluate the water and sediments status in the middle part of Shatt Al-Arab River, Ph.D. Thesis, University of Basrah, College of Science, Biology department, pp.240
Al-Khafaji B.Y., 1996, Trace metals in water, sediments and fishes from Shatt Al-Arab estuary north-west Arabian gulf, Ph.D. Thesis, Biology Dep., College of Education, Univ. Basrah., pp.131
Al-Khafaji B.Y., Mohammed A.B., and Maqtoof A.A., 2011, Distribution of some heavy metals in water, Sediments &Fish cyprinus carpio in Euphrates River near Al-Nassiriya city center South Iraq, Baghdad Sci. J., 8(1): 552-560
Al-Saffie A.G.A., 2005, Study of some of heavy elements in water, sediments and phytoplankton in Shatt Al-Arab River, M.Sc. Thesis, University of Basrah, College of Science, Biology Department, pp.85
Ayers R.S., and Westcot D.W., 1985, "Water Quality for Agriculture", FAO Irrigation and Drainage, pp.29
Balakrishnan A., and Ramu A., 2016, Evaluation of heavy metal pollution index (HPI) of ground water in and around the coastal area of gulf of mannar biosphere and Palk strait, J. Adv. Chem. Sci., 2(3): 331–333
Bhuiyan M.A.H., Islam M.A., Dampare S.B., Parvez L., and Suzuki S., 2010, Evaluation of hazardous metal pollution in irrigation and drinking water systems in the vicinity of a coal mine area of northwestern Bangladesh, J. Hazardous Materials, 179: 1065-1077
https://doi.org/10.1016/j.jhazmat.2010.03.114
Chester R., and Voutsinou F.G., 1981, The initial assessment of trace metal pollution in coastal sediments, Mar. Poll. Bull., 12(3): 84‐91
https://doi.org/10.1016/0025-326X(81)90198-3
Chougule M.B., Wasif A.I., and Naik V.R., 2009, Assessment of water quality index (WQI) for monitoring pollution of River Panchganga at Ichalkaranji, Proceedings of international conference on energy and environment, March 19-21 ISSN: 2070-3740 In Environenergy, 122-127
Hassan W.F., 2007, Geochemical and hydrochemical stady at Shatt Al-Arab chanal sediments and overlying water, Ph.D. Thesis, College of Agriculture, University of Basrah, pp.205
Hassan F.M., Saleh M.M., and Salman J.M., 2010, A study of physicochemical parameters and nine heavy metals in the Euphrates River, Iraq. E- Journal of Chemistry, 7(3):685-692
https://doi.org/10.1155/2010/906837
Iraqi systems for rivers maintains, In Yaqub Y.Y., 2011, Groups of laws, decisions, and instructions related to the works of ministry of water resources, part 2, pp.521
Majhi A., and Biswal S.K., 2016, Application of HPI (Heavy Metal Pollution Index) and correlation coefficient for the assessment of ground water quality near ash ponds of thermal power plants, International Journal of Science Engineering and Advance Technology (IJSEAT), 4(8): 395-405
Manoj K., Padhy P.K., and Chaudhury S., 2012, Study of heavy metal contamination of the river water through index analysis approach and environmetrics, Bull. Environ. Pharmacol. &Life Sci., 1(10): 7-15
Mastoi G.M., Shah S.G.S., and Khuhawar M.Y., 2008, Assessment of water quality of Manchar Lake in Sindh (Pakistan), Envi. Monit. Assess., 141: 287-296
https://doi.org/10.1007/s10661-007-9895-8
Meybeck M., Horowitz A.J., and Grosbois C., 2004, The geochemistry of seine river basin particulate matter: distribution of an integrated metal pollution index, Sci.Total Envi., 328: 219-236
https://doi.org/10.1016/j.scitotenv.2004.01.024
Mohan S.V., Nithila P., and Reddy S.J., 1996, Estimation of heavy metals in drinking water and development of heavy metal pollution index, J. Environ. Sci. Health., 31(2): 283-289
https://doi.org/10.1080/10934529609376357
Reza R., and Singh G., 2010, Heavy metals contamination and its indexing approach for river water, Intern. J. Envi. Sci. Technol., 7(4): 785-792
https://doi.org/10.1007/BF03326187
Song Y., Ji J., Mao C., Yang Z., and Yuan X., 2010, Heavy metal contamination in suspended solids of Changjiang River –environmental implication, Geoderma, 159: 286-295
https://doi.org/10.1016/j.geoderma.2010.07.020
Sturgeon R.E., Desaulniers J.A.H., Berman S.S., and Russell D.S., 1982, Determination of trace metals in estuarine sediments by graphite-furnace atomic absorption spectrometry, Analatical Chem. Acta., 134: 288-291
https://doi.org/10.1016/S0003-2670(01)84198-2
Taobi A.A.H., Ali B.Z., and Al-Hejuje M.M., 2000, Distribution of heavy elements and water chemistry in Al-Ashar and Al-Khandak canals connected with Shatt Al-Arab River –Basrah, Basrah J. Sci. B, 18(1): 69-80
US-EPA (United States –Environmental Protection Agency), 2012, Edition of the drinking water standards and health advisories EPA 822-S-12-001 office of water, U.S. Environmental Protection Agency Washington, DC Spring
WHO: World Health Organization, 2004, Guidelines for Drinking-Water Quality", 3ed edition, Vol.1 Geneva, Switzerland
WHO: World Health Organization, 2011, Guidelines for Drinking-Water Quality", 4th edition, Geneva 27, Switzerland
Yankey R.K., Fianko J.R., Osae S., Ahialey E.K, Duncan A.E., Essuman D.K., and Bentum J.K., 2013, Evaluation of heavy metal pollution index of groundwater in the Tarkwa mining area, Ghana, Elixir Pollution, 54: 12663-12667
Zhang W., Feng H., Chang J., Qu J., Xie H., and Yu L., 2009, Heavy metal contamination in surface sediments of YangtzeRiver intertidal zone: An assessment from different indexes, Env. Poll., 157: 1533-1543


. PDF(443KB)
. FPDF(win)
. HTML
. Online fPDF
Associated material
. Readers' comments
Other articles by authors
. Makia M. Al-Hejuje
. Najah A. Hussain
. Hamid T. Al-Saad
Related articles
. Shatt Al-Arab water
. HPI
. Heavy metals pollution
. Indices
Tools
. Email to a friend
. Post a comment