Influences of Environmental Factors on Fish Assemblage in the Tropical Estuary of South West Coast of India, A Case Study of Kodungallur-Azhikode Estuary 
 Author
  Correspondence author
International Journal of Marine Science, 2013, Vol. 3, No. 2 doi: 10.5376/ijms.2013.03.0002
Received: 20 Nov., 2012 Accepted: 21 Dec., 2012 Published: 26 Dec., 2012
Jayachandran et al., 2013, Influences of Environmental Factors on Fish Assemblage in the Tropical Estuary of South West Coast of India, A Case Study of Kodungallur-Azhikode Estuary, International Journal of Marine Science, Vol.3, No.2 4-16 (doi: 10.5376/ijms.2013.03.0002)
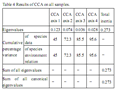
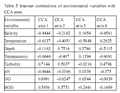
A proper monitoring of aquatic environment is crucial to appropriate management of the fisheries that rely on harvests from the environment and attempts of present study have been made to demonstrate links with environmental variability and fish abundance in the Kodungallur-Azhikode estuary (KAE). Annual average fish production in the estuary was declined considerably to 908.6 tons during 2009-2010, where 2747 tons was reported. Sixty three species of fin fishes, six species of penaeid shrimps, one species of Palaemonid prawns, two species of crabs, four species of bivalves and two species of edible oysters were observed in this study. Present study revealed that, Salinity is consistently the most important parameter explaining variation in assemblage composition and abundance of KAE; the availability of fish for recruitment into an estuary depends primarily upon the distributional range of euryhaline marine and estuarine species. The direct gradient analysis, first CCA axis, which explained most of the variation (45%) in the species data, was related to salinity, transparency and pH, and first two CCA axes together explained 72% of the cumulative percent variance of species-environment relationship. The importance of monitoring the estuarine condition in relation to fish assemblage was discussed, with significance on the potential use of estuarine fish assemblages and their monitoring and surveillance in management programs.
1 Introduction
The structure and function of estuarine ecosystems are sustained by synergistic feedbacks between organisms and their environment. While many investigations aimed at detecting environmental and ecological changes within estuaries had focused primarily on water quality and the associated biota, there are relatively few studies based exclusively on fishes (Whitfield and Elliott, 2002). Several investigators had suggested that biotic processes, such as competition and predation, might be influential in controlling the spatial and temporal patterns of occurrence of fish in estuaries. In addition, a various abiotic factors have been associated with the structure of fish assemblages including salinity, temperature, turbidity, dissolved oxygen, freshwater inflow, structural attributes of habitat, depth, and hydrography (Martino and Able, 2003).
Worldwide, nitrogen loadings resulting from human activities, as well as the number of estuaries and coastal seas reporting low dissolved oxygen concentrations had dramatically increased since the 1950s (Diaz, 2001; Boesch, 2002; Seitzinger et al., 2002; Diaz and Rosenberg, 1995). In many of the estuaries, illegal fishing had contributed to declining abundances of species that spend all or part of their life cycle in estuaries (Secor and Waldman, 1999; Lotze et al., 2006) and this recruitment of fishes from estuaries were strongly drive marine population dynamics (Elliott and Taylor, 1989). It was believed that large-scale patterns in the distribution of organisms result primarily from species responses to their physical environment, because dominant abiotic variables were thought to act like physiological sieve, thereby playing a vital role in the structuring of a community. Abiotic factors may set up the community framework, while biotic interactions refine species distribution patterns within this structure. However, much research on fish assemblages in estuaries has shown that salinity plays a major role in shaping assemblage structure (Whitfield, 1999).
Fisheries have a vital importance in contributing beneficial nutrition for human beings, providing raw material for the industrial sector, creating employment possibilities and high potential for export (Can and Demirci, 2012). Various estuarine wetland systems spreading over three lakh hectare form an important component of the inland fisheries resources of India (Sugunan, 2010). India produces an average of 4.6 million tonnes of fish annually from inland water bodies. The average yield of estuarine fish production in India was estimated to vary from 45 to 75 kg/ha (Jhingran, 1982). Thirty major backwaters of Kerala forming the crux of the coastal wetlands form an abode for over 200 resident and migratory fish and shellfish species and fishing activities in these water bodies provide the livelihood to about 200 000 fishers and also provide full time employment to over 50 000 fishermen (Bijoy Nandan, 2008). These are indispensable habitat to a variety of biologically and economically important aquatic fauna; moreover, the inter dependence of the adjoining marine and estuarine zones in completion of the life cycle of the finfish and shell fish species (Jhingran, 1982; Chao et al., 1982; Muelbert and Weiss, 1991; Vieira and Castello, 1997).
The Vembanad backwater has been extensively studied on the composition, distribution and gear wise catch of major fishery (Shetty, 1965; Kurup, 1982; Kurup and Samuel, 1985a; Kurup and Samuel, 1985b; Anon, 2001; Bijoy Nandan, 2008; Harikrishnan et al., 2011; Bijoy Nandan et al., 2012). Annual average fish production in the Vembanad lake and including other back waters of Kerala was estimated at 14 000 t ~ 17 000 t (Sugunan, 2010). Kodungallur-Azhikode estuary (KAE) is a northern extremity of Vembanad wetland ecosystem, is an ideal habitat for several species fin fish and shellfish species (Anon, 2001).
A comprehensive study in the fish diversity and abundance in relation to environmental variability in the Kodungallur-Azhikode estuary (KAE) in particular was lacking. This study discussed the diversity and abundance of fishes in relation to environmental quality and use of fishes as Indicators of ecological change and estuarine health.
2 Results
2.1 Environmental variables
The study area covered a both marine side (EMZ) and low saline side (EUZ) of estuarine transition zone. Wide range of variations in environmental variable was monitored during the study, which may potentially affect fish assemblage. Annual mean water column temperature in the KAE was 28.9℃ and it showed a clear vertical stratification especially during post monsoon season. Temporal variation was also noticed in the water column in both zones and it was lowest during south west monsoon (EMZ, 27.5℃; EUZ, 27.6℃) compared to pre monsoon and post monsoon seasons. The ANOVA of water temperature showed the variation between months were significant (p<0.01). The mean dissolved oxygen (DO) content of 5.1 mg/L was noticed in the KAE and monsoon period showed highest concentration (av. 5.8 mg/L) as compared to post monsoon period (5 mg/L) and pre monsoon period (5 mg/L). A noticeable trend was observed in the DO regime in the estuary, where surface water was higher than bottom waters. Surface water DO (5.6/mg) displayed comparatively higher values than that of bottom waters (4.7 mg/L). The ANOVA of DO showed that the variation between months were significant at 1% level (F=7.113). Carbon dioxide (CO2) values displayed highest mean in Station 5 (7.1 mg/L) and minimum in Station 7 (5.3 mg/L); temporarily the values were high in post monsoon (6.9 mg/L) as compared to monsoon period (6 mg/L) and pre monsoon period (6.3 mg/L) in the KAE. A remarkably high CO2 value of 14 mg/L was recorded in the bottom water in Station 2 (EMZ) during September and also comparatively high values were observed in the most of the stations particularly in stations 1 (7±3 mg/L) and 5 (7.1 mg/L). The ANOVA of CO2 between months showed variation and were significant at 1% level (F=18.324). The average biological oxygen demand (BOD) during the present study was 2.6 mg/L; it was high in the station 1 (3.1 mg/L) and temporarily it was high during monsoon (3.1 mg/L) as compared to the post monsoon (2.2 mg/L) and pre monsoon (2.3 mg/L) periods. Transparency values were generally low (0.6 m) in KAE particularly during monsoon season and it was negatively correlated with BOD values at 5% level (r =-0.688, p<0.05). In fact, high turbidity values were observed in the KAE with an average of 9.8 NTU with a peak concentration was recorded during south west monsoon season (20.2 NTU). Highest mean turbidity value was observed at mouth of the estuary (EMZ) represented by Station 1 (13.1 NTU).
The discernible spatio-temporal variation was also observed in the pH values and it was generally on an alkaline side (7.4). However the peak monsoon was marked by heavy rain, pH values tended to fall in all the stations of KAE (6.9). Higher pH values were observed in stations EMZ (station 1; 7.5) when compared to the station in EUZ (Station 7; 7.2). Relatively high alkalinity was observed during pre-monsoon period (43.7 mg/L), when compared to the monsoon (24.4 mg/L) and post monsoon (36.9 mg/L) seasons. Highest mean alkalinity value was recorded at station 1 (40.3 mg/L). The ANOVA of alkalinity showed the variation between months were significant at 1% level (F=22.490). Average salinity of estuary showed mesohaline nature. The maximum average salinity was recorded at mouth region (Station1; 18.9 psu) and minimum at EUZ (Station 7; 10.2 ± 8.6 psu). Clear vertical stratification and seasonality were observed in salinity pattern. The salinity values showed a definite trend, where it decreased from estuarine mouth to head. During the monsoon period (June to September) salinity values were comparatively low (5.4 psu); however, salinity enormously increased (21.6 psu) during post monsoon period (October to January). But, salinity tends to decrease (16.1 psu) during pre-monsoon period (February-May), as a result of commencement of south west monsoon. The ANOVA of salinity showed that the variation between months were significant (F=33.433, p<0.01). Tides in the KAE are semidiurnal, with amplitude of 1m during spring tide and 60 cm during neap tides and average rain fall in the area was 310 cm (Revichandran and Abraham, 1998). During the present study average macronutrient concentration observed in the KAE were (15.0±12.1) µmol/L for dissolved inorganic nitrogen (DIN), 49.1 ± 28.7 µmol/L for dissolved inorganic silicate (DISi), and 1 ± 1.3 µmol/L for dissolved inorganic phosphate (DIP). Among the three major macronutrients, DIP concentrations were comparatively low in the KAE. The average nitrate- nitrogen (NO3-N) of KAE water was 10.2 µmol/L. The average NO3-N values ranged from 7.9 ± 9.9 µmol/L in Station 2 (EMZ) to 13.6 µmol/L in Station 7 (EUZ). Comparatively high NO3-N was observed during monsoon period (19.1 ± 19.4 µmol/L), whereas relatively low NO3-N content was observed in post monsoon (7.4 ± 3.6 µmol/L) and pre monsoon periods (3.8 ± 3.3 µmol/L). The ANOVA of macronutrient showed monthly variations significant at 1% level; (nitrate-nitrogen, F=50.537; silicate-silicon, F=38.965; phosphate-phosphorus, F=10.897). The average Chl-a for the seven stations of KAE was 6.42 mg/m3 and varied from 5.07 mg/m3 in Station 2 (EMZ) to 7.80 mg/m3 in Station V. Peak value of Chl-a was observed during pre-monsoon period (10.89 mg/m3) and decreased to an average of 5.16 mg/m3 during the monsoon season. The ANOVA of Chl-a showed the variation between months were significant at 1% level (F=14.295). The GPP showed an average of 1580 mg C m-3d-1 and NPP was 790 mg C m-3d-1 during the study period. Highest GPP was observed during pre-monsoon (1785 mg C m-3d-1) followed by post monsoon (1589 mg C m-3d-1) and monsoon (1 517 mg C m-3d-1). Generally increased GPP was noticed in the stations of EMZ (Station 1; 1625 mg C m-3d-1, Station 2; 1750 mg C m-3d-1 and Station 3, 1750 mg C m-3d-1). Highest NPP was observed during post monsoon (1035 mg C m-3d-1) followed by monsoon (828 mg C m-3d-1) and pre monsoon (585 mg C m-3d-1) respectively. Relatively high mean NPP values were observed in Station 3 (921 mg C m-3d-1) but Station 6 showed comparatively low average NPP values (588 mg C m-3d-1).
2.2 Fish abundance, species richness, and diversity
A total of 144 tows (EMZ, 72; EUZ, 72) data were collected representing 63 fin fishes belonging to 37 families (Table 1). Six species of penaeid shrimps, one species of palemonid prawns, two species of crabs, four species of clams and two species of edible oysters were observed. The average fish production in the KAE was estimated at 908.6 tons during the present study (2009-2010). Fin fish catches were dominated by Ambassis ambassis, Eubleekeria splendens, Mugil cephalus, Leiognathus berbis, Etroplus maculatus, Lisa parsia, Lisa macrolepis, Oreochromis mossambicus, Photopectoralis bindus, Plicofollis dussumieri, Etroplus suratensis, Valamugil speigleri, Gerres erythrouru. Fenneropenaeus indicus, Penaeus monodon, Penaeus semisulcatus, Metapenaeus monoceros, Metapenaeus dobsoni, Metapenaeus affinis, Macrobrachium rosenbergii, Scylla serrate, Scylla tranquebarica (Table 2) were the shell fishes observed in the catch. Villorita cyprinoides, Paphia malabarica, Meretrix casta, Meretrix meretrix, Crassostrea madrasensis and Saccostrea cucullata were the bivalves noticed during the study. Comparatively good Fish diversity (Figure 1) was observed in both zones of KAE (EMZ, 3.264; EUZ, 3.183). Fish assemblage in the estuary showed fish richness (d) value of 8.32 (EMZ) and 9.30 (EUZ); evennes of 0.79 (EMZ), and 0.75 (EUZ); dominance (D) of 0.915 (EMZ) and 0.912 (EUZ).
|
|
.png)
|
|
.png)
|
|
.png)
|
|
.png)
|
|
.png)
|
|
|
|
3.2 Assemblage structure and assemblage- environment relationships
|
|
.png)
Estuary was classified into two zones based on general morphology and environmental characteristics of estuary, estuarine mouth zone (EMZ) and estuarine upper zone (EUZ). Landing centre based direct data collection method was adopted for the fish landing estimation (FAO, 2002). Azhikode, Anapuzha and Krishnankotta were the major fish landing centers of the estuary.
The fish catch composition, gear wise catch (%) of the fish diversity were studied in the KAE during July 2009 to June 2010 period. Catch per unit effort (CPUE) is defined as one tow of the net which occurred once per site or the number of fish collected per tow. CPUE for fish assemblages were estimated using standard an otter trawl (3.5 head rope, 30 mm mesh wings, 18 mm mesh cod end) towed by small boat. CPUE was expressed as No. 100 m-net hr-1 and used as index of relative abundance (FAO, 2002). The total catch was sort out into finfish, shrimp, prawn, crab, molluscs and other species by visual assessment. After sorting and counting, representative samples were preserved in 10% formalin for taxonomic studies in the Laboratory. The species wise identification of fishery was done based on standard works (Day, 1889; Talwar and Jhingran, 1991; Jayaram, 1999; Munro, 2000) and also Fish Base (Fishbase, 2012).
Water quality parameters from different zones were also collected on an array of environmental variables that can be potentially influence the fish communities. Water transparency (Secchi disk transparency; SD) was measured by Secchi disk in the field. Dissolved oxygen (DO) was estimated according to Winkler’s method (Grasshoff et al., 1983). pH by Systronics pH meter (No. 335; accuracy ± 0.01). For the estimation of Chl-a, acetone extraction method was employed (Parsons et al., 1984). Primary productivity was estimated by in situ incubation method using the light and dark bottle oxygen method (Strickland and Parsons, 1972). Temperature of water samples were measured with a centigrade thermometer, conductivity by Systronics digital potentiometer (No. 318), turbidity by Systronics water analyser (No. 317) and salinity by Systronics water analyser (Model No. 317; accuracy ± 0.01) calibrated with standard seawater (APHA, 2005). Carbon dioxide, alkalinity, hardness and biological oxygen demand (BOD) was determined by standard procedures (APHA, 2005).
4.3 Data analysis
The structure of the fish assemblage was analyzed via direct gradient analysis methods. Direct gradient techniques elucidate the role of environmental variables in shaping the assemblage structure. Direct gradient analysis methods are useful in determining the relative importance of measured environmental variables, but may lead to a biased ordination of the species data depending on the available environmental data. Canonical Correspondence Analysis (CCA) is becoming the most widely used method of direct gradient analysis in ecology (Rakocinski et al., 1996). The CCA algorithm performs better than other direct gradient techniques when faced with certain problematic characteristics of ecological datasets, such as skewed species’ distributions, quantitative noise in species’ abundance data, unusual sampling designs, highly inter-correlated environmental variables, and unknown species-determining factors. The software package CANOCO version 4 (ter Braak and Smilauer, 1998) was used to perform all ordinations. Two-way analysis of variance (ANOVA) was applied to calculate the variation in hydrographic and biological parameters (SPSS 18v.). Primer 6.0v was used to study fish diversity in the KAE (Clarke and Gorley, 2006).
Author Contributions
SBN is the supervisor of the project. SBN, PRJ, OKS and VFS made the experimental design, data analysis, manuscript preparation.
Acknowledgements
This work forms part of the research project entitled “Ecology and fish production potential of the Kodungallur-Azhikode back water ecosystem” funded by the Kerala State Council for Science, Technology and Environment (KSCSTE) and the authors are thankful for financial assistance. Authors are thankful to The Head and Ecology Division, Department of Marine Biology, Microbiology and Biochemistry, Cochin University of Science and Technology for providing necessary facilities.
Anon, 2001, Ecology and Fisheries Investigation in Vembanad Lake, CIFRI Bulletin No.107: 38
Bijoy Nandan S., 2008, Current status and biodiversity modification in the coastal wetland ecosystems of India with objectives for its sustainable management, Proc. conserve-vision conference, The University of Waikato, www.waikato.ac.n/wtass/conserve-vision
Bijoy Nandan S., Jayachandran P.R., and Sreedevi O.K., 2012, Temporal pattern of fish production in a microtidal tropical estuary in the south-west coast of India, Indian Journal of Fisheries, 59: 17-26
Boesch D.R., 2002, Challenges and opportunities for science in reducing nutrient over- enrichment of coastal ecosystems, Estuaries, 25: 886-900
http://dx.doi.org/10.1007/BF02804914
Breitburg D.L., Hondorp D.W., Davias L.A., and Diaz R.J., 2009, Hypoxia, nitrogen, and ï¬ï¿½sheries: integrating effects across local and global landscapes, Annual Review of Marine Science, 1: 329-349
http://dx.doi.org/10.1146/annurev.marine.010908.163754
Can M.F., and Demirci A., 2012, Fisheries Management in Turkey, International Journal of Aquaculture, 2: 48-58
Chao L.N., Pereira L.E., Vieira J.P., Bemvenuti M.A., and Cunha L.P.R., 1982, Relacao preliminar dospeixes estuarinos e marinhos da Lagoa dos Patos e regiao costeira adjacente, Rio Grande do Sul, Brasil, Atlantica, 5: 67-75
Day F., 1889, The fauna of British India including Ceylon and Burma 1&2: 548 & 609
Diaz R.J., 2001, Over view of hypoxia around the world, Journal of Environmental Quality, 30: 275-281
http://dx.doi.org/10.2134/jeq2001.302275x PMid:11285887
Diaz R.J., and Rosenberg R., 1995, Marine benthic hypoxia: a review of its ecological effects and the behavioral responses of benthic macrofauna Oceanography and Marine Biology Annual Review, 33: 245-303
Eby L.A., and Crowder L.B., 2004, Effects of hypoxic disturbances on an estuarine fish and crustacean community: a multi-scale approach, Estuaries, 27: 342-351
http://dx.doi.org/10.1007/BF02803390
Elliott M., and Taylor C.J.L., 1989, The production ecology of the subtidal benthos of the Forth Estuary, Scotland (Proc. 22nd Eur. Mar. Biol. Symp.), Scientia Marina, 53: 531-541
Fao, 2002, Sample-based fishery surveys - A technical handbook, FAO- Fisheries technical paper, 425: 132
Fishbase, 2012, www.fishbase.org
Grasshoff K., Ehrhardt M., and Kremling K., 1983, Methods of sea water analysis, Verla Chamie, Weinheim, Germany
Harikrishnan M., Vipin P.M., and Kurup B.M., 2011, Status of exploited fishery resources of Azhikode Estuary, Kerala, India, FISH Technology, 48: 19-24
Kupschus S., and Tremain D., 2001, Associations between fish assemblages and environmental factors in nearshore habitats of a subtropical estuary, Journal of Fish Biology, 58: 1383-1403
http://dx.doi.org/10.1111/j.1095-8649.2001.tb02294.x
Kurup B.M., and Samuel C.T., 1985a, Fish and fishery resources of the Vembanad lake, Proc. Harvest and post harvest technology of fish: 77–82
Kurup B.M., and Samuel C.T., 1985b, Fishing gear and fishing methods in Vembanad Lake, Proc. Harvest and post harvest technology of fish: 232–237
Lotze H.K., Lenihan H.S., Bourque B.J., Bradbury R.H., Cooke R.G., Kay M.C., Kidwell S.M., Kirby M.X., Peterson C.H., and Jackson J.B.C., 2006, Depletion, degradation, and recovery potential of estuaries and coastal seas, Science, 163: 1806-1809
http://dx.doi.org/10.1126/science.1128035 PMid:16794081
Maes C., Ando K., Delcroix T., Kessler W.S., Mcphaden M.J., and Roemmich D., 2006, Observed correlation of surface salinity, temperature and barrier layer at the eastern edge of the western Pacific warm pool, Geophysical Research Letters, 33: L06601
http://dx.doi.org/10.1029/2005GL024772
Martin G., Nisha P., Balachandran K., Madhu N., Nair M., Shaiju P., Joseph T., Srinivas K., and Gupta G., 2011, Eutrophication induced changes in benthic community structure of a flow-restricted tropical estuary (Cochin backwaters), India, Environmental Monitoring and Assessment 176: 427-438
http://dx.doi.org/10.1007/s10661-010-1594-1 PMid:20640505
Martin J.A., and Michael P., 2002, Climatic influence on a marine fish assemblage, Nature 417: 275-278
http://dx.doi.org/10.1038/417275a PMid:12015600
Martino E.J., and Able K.W., 2003, Fish assemblages across the marine to low salinity transition zone of a temperate estuary, Estuarine, Coastal and Shelf Science, 56: 969-987
http://dx.doi.org/10.1016/S0272-7714(02)00305-0
Menon N.N., Balchand A.N., and Menon N.R., 2000, Hydrobiology of the Cochin backwater system-a review, Hydrobiologia, 430: 149-183
http://dx.doi.org/10.1023/A:1004033400255
Muelbert J.H., and Weiss G., 1991, Abundance and distribution of fish larvae in the channel area of Patos Lagoon estuary, Brazil. In: R. Dhbyt (ed.), Larval fish recruitment and research in the Americas, Proc. Thirteenth Annual Fish Conference, 95: 43-54
Munro I.S.R., 2000, The marine and freshwater fishes of Ceylon, Narendra Publishing House, India
Rakocinski C.F., Lyczkowski-Shultz J., and Richardson S.L., 1996, Ichthyoplankton Assemblage Structure in Mississippi Sound as Revealed by Canonical Correspondence Analysis, Estuarine, Coastal and Shelf Science, 43: 237-257
http://dx.doi.org/10.1006/ecss.1996.0067
Revichandran C., and Abraham P., 1998, Mixing and flushing time scale in the Azhikode estuary, south west coat of India, Indian journal of Geo-Marine Sciences, 27: 163-166
Secor D.H., and Waldman J.R., 1999, Historical abundance of Delaware Bay Atlantic sturgeon and potential rate of recovery, American Fisheries Society Symposium, 23: 203-216
Seitzinger S.P., Kroeze C., Bouwman A.F., Caraco N., Dentener F., and Styles R.V., 2002, Global patterns of dissolved inorganic and particulate nitrogen inputs to coastal systems: recent conditions and future projections, Estuaries, 25: 640-655
http://dx.doi.org/10.1007/BF02804897
Shetty H.P.C., 1965, Observations on the fish and fisheries of the Vembanad backwaters, Kerala, Proc. National Academy of Science, 35: 115
Strickland J.D.H., and Parsons T.R., eds., 1972, Bulletin of Fisheries Research Board of Canada, Ottawa, Canada, pp. 167-310
Sugunan V.V., 2010, Inland fisheries resource enhancement and conservation In India. Inland fisheries resource enhancement and conservation In Asia, Inland fisheries resource enhancement and conservation - Asia, 22: 35-60
Ter Braak C.J.F., and Smilauer P., 1998, CANOCO reference manual and users guide to CANOCO for windows: software for canonical community ordination, version 4
Vernberg F.J., 1982, Environmental adaptation to lagoon systems, Oceanologica Acta, 4: 407-415
Vieira J.P., and Castello J.P., eds., 1997, Fish fauna: Subtropical convergence environment, The coast and sea in the southwestern Atlantic, Berlin, Springer, pp. 56-61
Vivekanandan E., and Sivakami S., eds., 2007, Status of demersal fisheries research in India, In: Mohan Joseph M., and Pillai N.G.K., (eds.), Status and Perspectives in Marine Fisheries Research in India, CMFRI, Cochin, pp. 115-134
Wallace J.H., 1975a, The estuarine fishes of the east coast of South Africa Part I. Species composition and length distribution in the estuarine and marine environments, Part II. Seasonal abundance and migrations, Oceanographic Research Institute Investigational Report No. 40
Wallace J.H., 1975b, The estuarine fishes of the east coast of South Africa., Part III. Reproduction. Oceanographic Research Institute Investigational Report No.41
Weisberg S.B., Himchak P., Baum T., Wilson J.H.T., and Allen R., 1996, Temporal trends in abundance of fish in the tidal Delaware River, Estuaries, 19: 723-729


. PDF(529KB)
. FPDF(win)
. HTML
. Online fPDF
Associated material
. Readers' comments
Other articles by authors
. P.R. Jayachandran
. S. Bijoy Nandan
. O.K. Sreedevi
. V.F. Sanu
Related articles
. Kodungallur-Azhikode estuary
. Fish productivity
. Water quality
. Eutrophication
Tools
. Email to a friend
. Post a comment