Spatial and Temporal Variation of Total Nitrogen and Total Phosphorus in Major River Systems of Sundarbans Mangrove Forest, Bangladesh  

S.M. Bazlur Rahaman , Md. Sharif Hasan Sohag , Alokesh Kumar Ghosh , Sudhin Kumar Biswas , Lipton Sarder , Joyanta Bir , Shahjahan Siraj Opu
Fisheries and Marine Resource Technology Discipline, Khulna University, Khulna-9208, Bangladesh
Author    Correspondence author
International Journal of Marine Science, 2013, Vol. 3, No. 16   doi: 10.5376/ijms.2013.03.0016
Received: 11 Mar., 2013    Accepted: 09 Apr., 2013    Published: 12 Apr., 2013
© 2013 BioPublisher Publishing Platform
This is an open access article published under the terms of the Creative Commons Attribution License, which permits unrestricted use, distribution, and reproduction in any medium, provided the original work is properly cited.
Preferred citation for this article:

Rahaman at al, 2013, Spatial and Temporal Variation of Total Nitrogen and Total Phosphorus in Major River Systems of Sundarbans Mangrove Forest, Bangladesh, International Journal of Marine Science, Vol.3, No.16 128-134 (doi: 10.5376/ijms.2013.03.0016)

Abstract

Mangrove provides a unique ecological environment for diverse communities and Sundarbans is a rapidly changing ecosystem due to various anthropogenic activities. In order to assess the spatial and temporal variation of total Nitrogen and total Phosphorus concentration in Major River Systems of Sundarbans, a study was carried out from September, 2010 to February, 2011. Fourteen sampling location from major river systems were chosen. During post monsoon and winter seasons the range of total Phosphorus (0.326-0.409 mg/L and 0.091-0.371 mg/L respectively) and total nitrogen (2.52-3.50 mg/L and 3.43-5.25 mg/L respectively) were observed in Rupsha - Passur river system. On the other hand the range of total Phosphorus (0.475-0.144 mg/L and 0.060-0.113 mg/L respectively) and total nitrogen (2.31-3.61 mg/L and 3.22- 5.95 mg/L respectively) were found in Arpangashia - Malancha river system during post monsoon and winter seasons. The nutrients of water of Baleswar- Bhola river system during rainy and dry seasons were found in the range of total Phosphorus (0.106-0.364 mg/L and 0.053-0.075 mg/L respectively) and total nitrogen (2.59-3.57 mg/L and 2.87-5.60 mg/L respectively). Total Nitrogen and total phosphorus levels were relatively higher than the EPA standards for surface water during the two seasons. The Dynamic nutrients level observed in the study area may have severe consequences on the in-dwelling aquatic flora and fauna.

Keywords
Nutrients; Post monsoon; Winter; Arpangashia; Baleswar

Mangrove ecosystems are important contributors of organic Nitrogen, Phosphorus and other nutrients to the adjacent coastal ecosystems. The mangrove ecosystem may significantly influence adjacent coastal areas through various mechanisms such as nutrient and carbon export. The mangroves provide nutrients for phytoplankton growth, thus enhancing secondary production and promotion of commercial fisheries. The net primary production of mangroves derived inputs into mangrove creeks seems to be an important factor affecting the direction and magnitude of material fluxes (Parikh and Datye, 2003). The distribution and behavior of nutrients are usually affected by tidal, seasonal and weather conditions. Sediments suspended in the water column are deposited in mangroves during flooding, enriching mangrove soil and water. The nutrient cycle and nutrient fluctuation of Mangrove Rivers has direct effects on the organisms. The SRF has also importance as for diverse plants, reptiles, fishes and birds. The vegetation of SRF provides food for various fishes, crustaceans, mollusks and other aquatic organisms. Nitrogen and Phosphorus are dietary requirement for all organisms, because they are constituent of all proteins and nucleic acids. Phosphorus present in small quantity but has a dramatic effect on water nutrition system. Nitrogen is essential for plants, and can be found in air in large amounts. This elementary nitrogen and Phosphorus cannot be taken up directly. Nitrogen must first be bound and converted, for instance to nitrate. Nitrogen and phosphorus are necessary nutrients for organisms, and are also major elements that cause eutrophication when exceeding the assimilation capacity of receiving waters (Abal et al., 2005). The transportation of nitrogen and phosphorus from the land to sea is an important process component in bio-geochemical cycling (Turner et al., 2003). Many studies have shown that, major factors contributing to nitrogen input in the water include industry, agriculture (fertilizer) and population (Meybeck and Helmer, 1989; Benjamin et al., 1991; Xing and Zhu, 2000; Gregory et al., 2001). The behaviour of nitrogen in mangrove environment depends on the ion exchange capacity, redox conditions, organic matter and clay content of the sediment. Marine coastal waters often receive high loads of nutrients (namely nitrogen and phosphorus due to human activities that may lead to serious eutrophication problems and deteriorating the coastal environment (Ranjan et al., 2008). Various studies have shown that over past few decades more than 55% of the mangrove land in Sundarban has been acquired for residential agricultural or industrial purposes, resulting in increased anthropogenic discharge in the Riverine system.

The greatest volume of wastes discharged to coastal waters is sewage, which is primarily organic in nature and subject to bacterial decay. Sewage pollution is manifested in the low dissolved oxygen levels and in high nutrient levels in these waters, which can lead to an imbalance of plant and animal communities through the food web (Johnston, 1976). Research on coastal water circulation and nutrient dynamics in tropical and subtropical regions has received considerable attention in the recent past because of the importance of hydro- and nutrient dynamic processes in determining the short and long-term sustainability of coastal ecological systems. Though its huge importance as a forest for its plants, animals and mangrove fishery but there is very limited information regarding the major nutrient dynamics specially nitrogen and phosphorus in this vital water body. So, the present study has been undertaken to know the variation of total nitrogen and total phosphorus in some selected major River systems. The data generated from this study will guide the scenario of major nutrients and will serve as baseline for further research.
1 Materials and Methods
1.1 Study area and time
The study was conducted in three major River systems Rupsha-Passur (R-P), Arpangashia- Malancha (A-M) and Baleswar-Bhola (B-B) of the Sundarbans Mangrove Forests, Bangladesh (Figure 1). The Sundarbans is the largest single block of tidal halophytic mangrove forest in the world, lies at the mouth of the Ganges and is spread across areas of Bangladesh and West Bengal, India, forming the seaward fringe of the delta. The Sundarbans, covers an area of 6 017 km2, of which 4 143 km2 are landmass and remaining 1 874 km2 are under water bodies, in form of Rivers, canals and creeks (Karim, 1995). The coast of the sundarban is criss crossed by a network of complex estuarine network formed by the River Rupsha, Passur, Shibsha, Arpangashia, Baleswar, Vola and other Rivers which opens into the Bay of Bengal through Sunderban Reserved Forest (SRF) and carry a large amount of nutrients which facilitate the productivity in the area (Chaffey and Chitkara, 1985). The River Balaswar in the east is the main source of fresh water although several others also bring water from the Ganges during the rainy season. These Rivers are therefore, more susceptible to dry season reduction in stream flow and tidal intrusion of saltwater (Hasan, 2001).


Figure 1 Map of study area with the location of sampling points


 1.2 Sampling stations and sampling period
The water samples were collected from several sampling points of three major River systems of sunderbans which are given in Table 1. The sampling period was divided into two seasons, Post monsoon and winter. Post monsoon includes September to November and winter includes December to February. In post monsoon the sampling time of Passur River was done at September, 2010. This was repeated at November, 2010 in winter. Sampling period of Arpangashia River was October, 2010 in post monsoon and December, 2011 at winter. The sampling period of Baleswar and Bhola River was during December month and February month respectively.


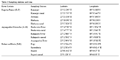
Table 1 Sampling stations and time


1.3 Sample collection
Water samples were collected from the surface layer of the water body with water sampler during high tide. Water samples were collected from the Rivers at each sample point and stored in pre-cleaned plastic containers. The volume of containers was two liters. Once collected, the samples were immediately stored on ice in a cooler box and transported to the laboratory and were stored at 4.
1.4 Total Nitrogen analysis
The Nitrogen is distilled and determined by Kjeldahl, titration, method (Saxena, 1998) by the following formula TON mg/L=(T-B)×N×1000×14/Volume of sample Where, T=volume of titrant (Hcl) used against sample (mL); B=volume of titrant (Hcl) used against blank (mL); N=Normality of titrant (0.01); 14= Atomic mass of Nitrogen.
1.5 Total phosphorus analysis
This ortho-phosphate can be determined by ascorbic acid method (River Watch Network, 1991) by the Preparation of calibration curve (Figure 2).


Figure 2 Standard curve for Phosphorus analysis

1.6 Data presentation
Microsoft Excel was used for the analysis and graphing of collected data.
2 Results and Discussion
2.1 Total Nitrogen-TN
In Rupsha-Passur River system, the mean value of TN was 2.10±0.41 mg/L in post monsoon and the mean value of TN was 4.47±0.72 mg/L in winter season (Figure 3). The maximum concentration of TN occurred, 5.04±0.33 mg/L at Karamjal canal surface water in winter and the minimum concentration, 2.52±0.12 mg/L was observed at surface water of Herbaria River in post monsoon.
 

Figure 3 Spatial and temporal variation of total Nitrogen in Rupsha-Passur River system in the winter and post monsoon season


In Arpangashia-Malancha River system, the mean value of TN was 2.78±0.38 mg/L in post monsoon and the mean value of TN was 4.22±1.05 mg/L in winter season (Figure 4). The maximum concentration of TN, 5.95±0.28 mg/L was observed at surface water of Poshurtola River in winter and the minimum concentration, 2.52±0.23 mg/L was observed at surface water of Arpangashia in post monsoon. In Baleswar-Bhola River system, the mean value of TN was 3.02±0.428 mg/L in post monsoon and the mean value of TN was 3.87±1.20 mg/L in winter season (Figure 5). The maximum concentration of TN was found, 5.60±0.32 mg/L at surface water of Sarankhola in winter and the minimum concentration, 2.59±0.20 mg/L was observed at surface water of Supoti River in post monsoon. 
 

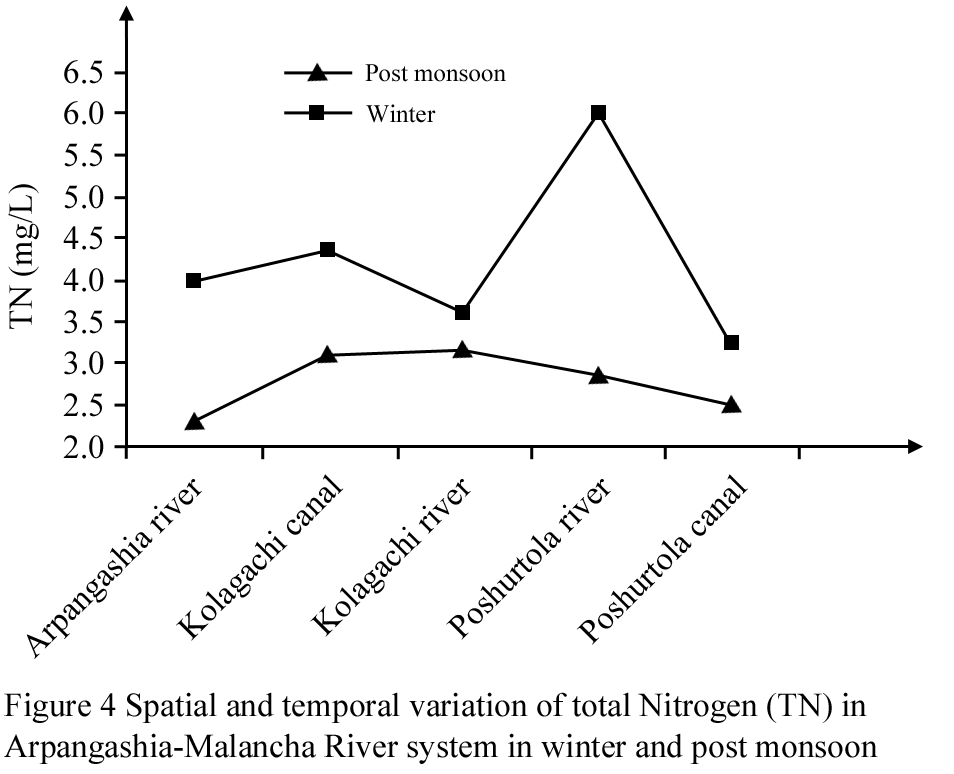
Figure 4 Spatial and temporal variation of total Nitrogen (TN) in Arpangashia-Malancha River system in winter and post monsoon


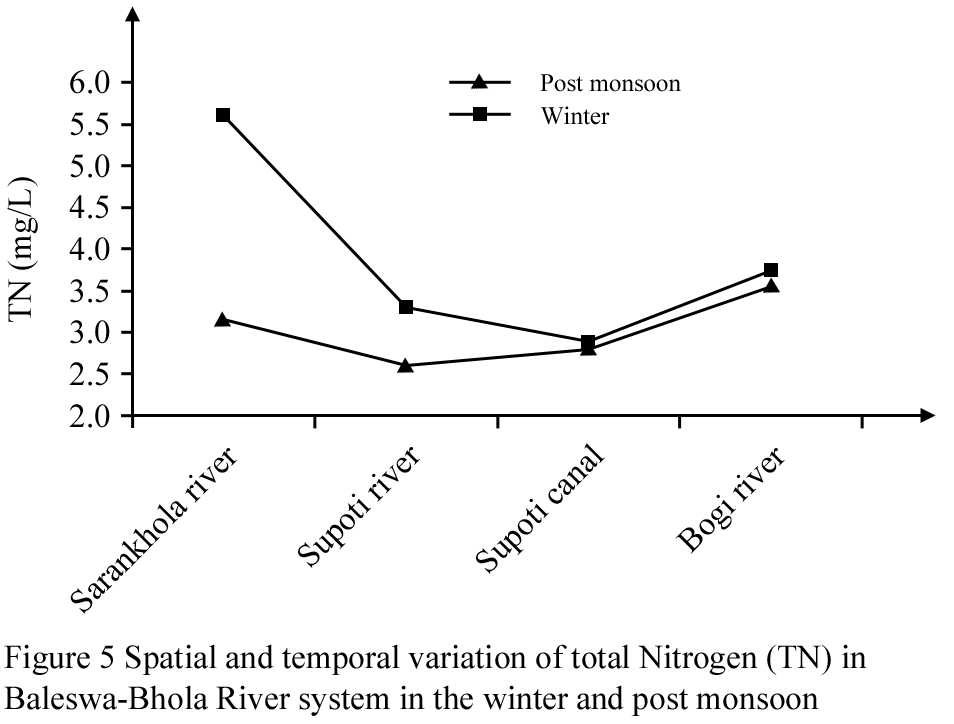
Figure 5 Spatial and temporal variation of total Nitrogen (TN) in Baleswa-Bhola River system in the winter and post monsoon


In Baleswar-Bhola River system, the mean value of TN was 3.02±0.428 mg/L in post monsoon and the mean value of TN was 3.87±1.20 mg/L in winter season (Figure 5). The maximum concentration of TN was found, 5.60±0.32 mg/L at surface water of Sarankhola in winter and the minimum concentration, 2.59±0.20 mg/L was observed at surface water of Supoti River in post monsoon.

During post monsoon season, TN concentration varied between 2.52 mg/L and 3.50 mg/L in Rupsha-Passur River. In Arpangashia and Malancha River system it was varied from 2.31 mg/L to 3.61 mg/L and in Baleswar and Bhola River it was varied between 2.80 mg/L and 3.57 mg/L respectively (Figure 6).


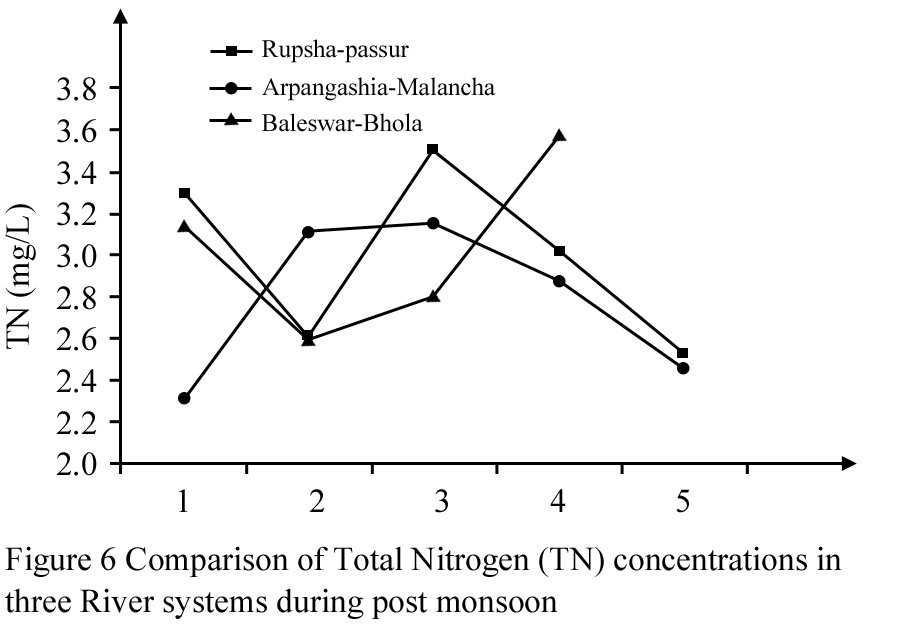
Figure 6 Comparison of Total Nitrogen (TN) concentrations in three River systems during post monsoon

During winter season, TN concentration varied between 0.091 mg/L and 0.371 mg/L in Rupsha-Passur River system. In Arpangashia and Malancha River it varied from 3.22 mg/L to 5.95 mg/L and in Baleswar and Bhola River it varied between 2.87 mg/L and 5.60 mg/L (Figure 7).


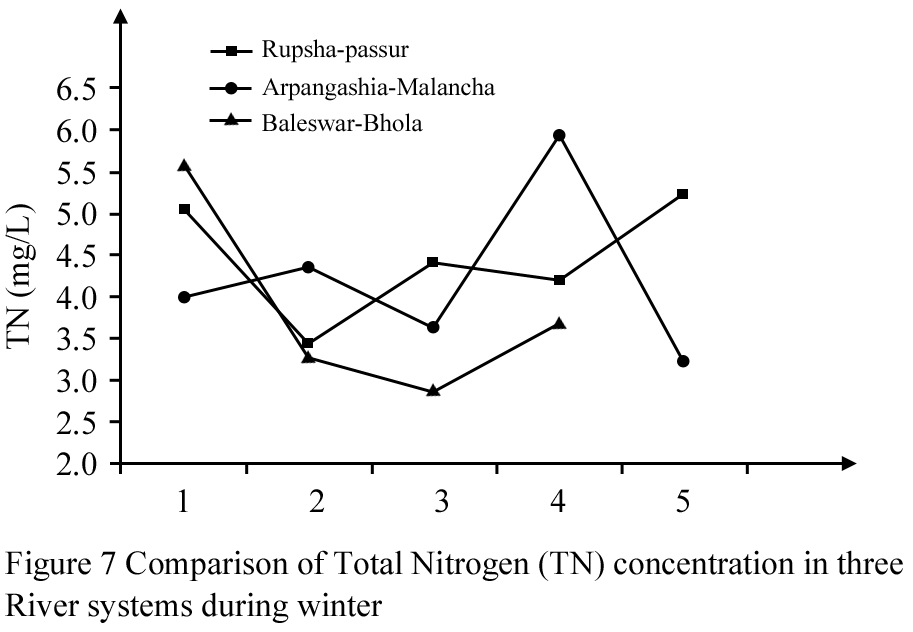
Figure 7 Comparison of Total Nitrogen (TN) concentration in three River systems during winter

2.2 Total phosphorus-TP
In Rupsha-Passur River system, the mean value of TP was 0.379±0.031 mg/L in post monsoon and the mean value of TP was 0.204±0.104 mg/L in winter season (Figure 8). The minimum concentration of TP, 0.091±0.008 mg/L occurred at surface water of Herbaria in winter and the maximum concentration, 0.409±0.042 mg/L was observed at surface water of Karamjal River in post monsoon.


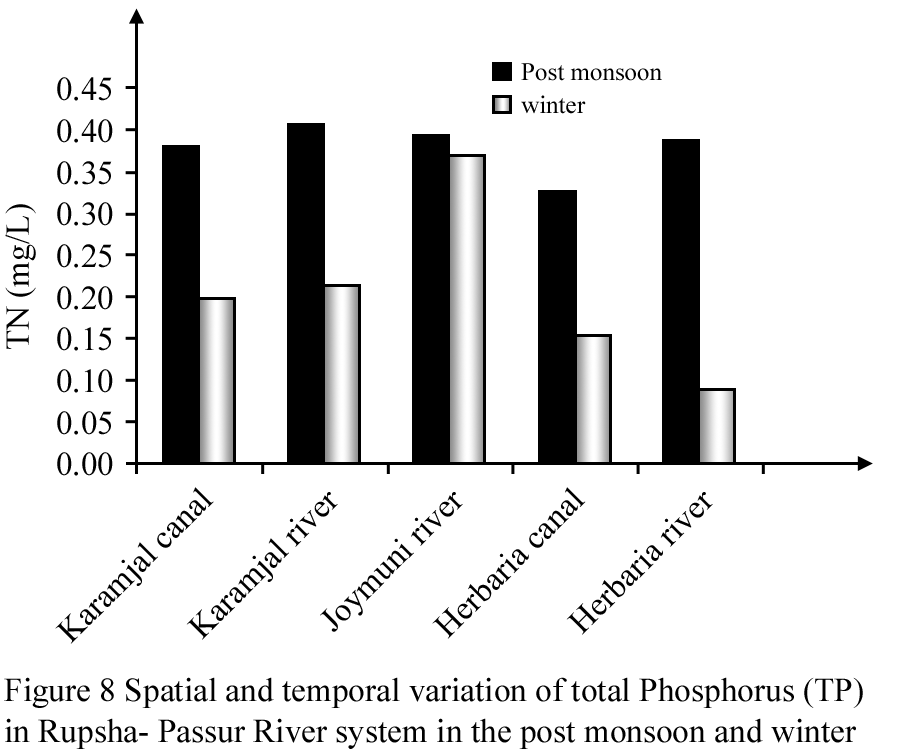
Figure 8 Spatial and temporal variation of total Phosphorus (TP) in Rupsha- Passur River system in the post monsoon and winter

In Arpangashia-Malancha River system, the mean value of TP was 0.113±0.029 mg/L in post monsoon and the mean value of TP was 0.078±0.023 mg/L in winter season (Figure 9). The highest TP concentration 0.144±0.018 mg/L was observed at Kolagachi canal and lowest concentration 0.075±0.004 mg/L was observed at surface water of Poshurtola during post monsoon in Arpangashia River and Malancha River system.


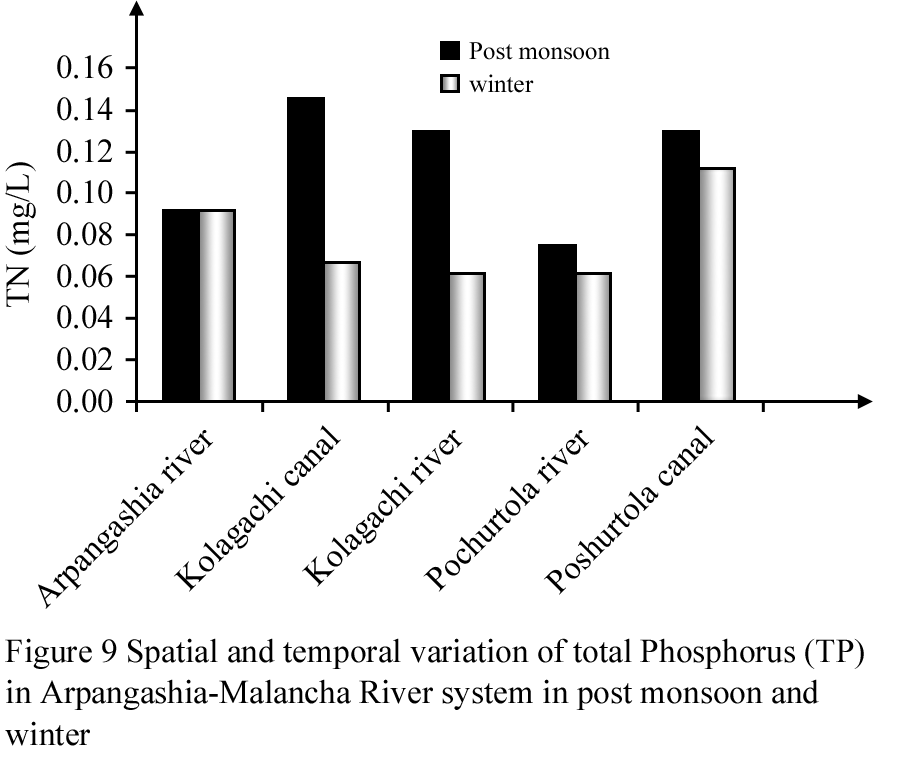
Figure 9 Spatial and temporal variation of total Phosphorus (TP) in Arpangashia-Malancha River system in post monsoon and winter

In Baleswar-Bhola River system, the mean value of TP was 0.214±0.08 mg/L in post monsoon and the mean value of TP was 0.092±0.038 mg/L in winter season (Figure 10). The maximum concentration, 0.364±0.06 mg/L was observed at surface of Supoti canal water in post monsoon and the minimum concentration of TP, 0.053±0.001 mg/L occurred at surface water of Bogi in winter.


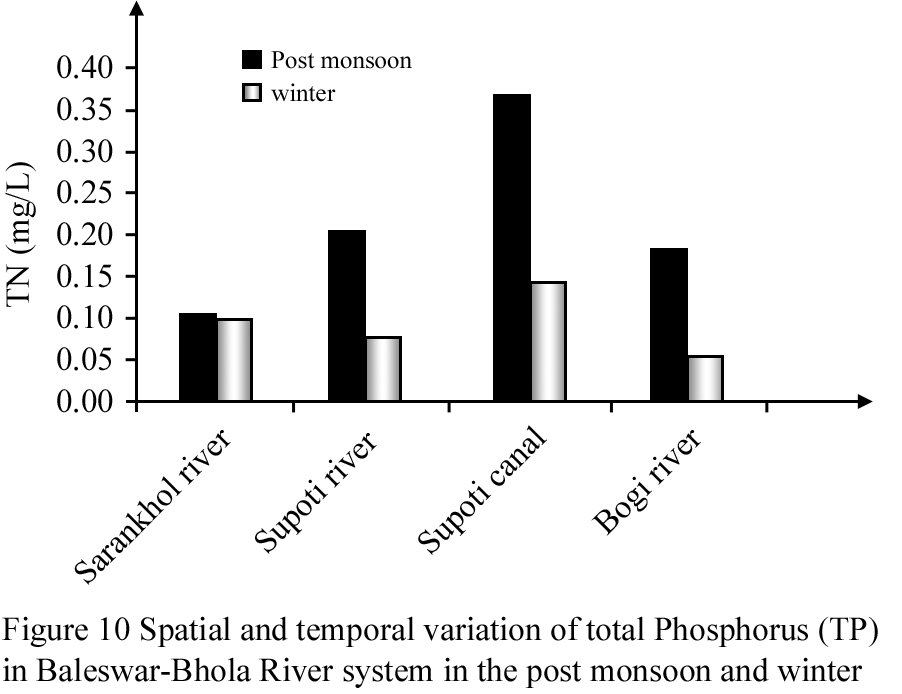
Figure 10 Spatial and temporal variation of total Phosphorus (TP) in Baleswar-Bhola River system in the post monsoon and winter

 
During post monsoon season, TP concentration varied from 0.326 mg/L to 0.409 mg/L in Passur River. In Arpangashiaand and Malancha River it varied from 0.075 mg/L to 0.144 mg/L and in Baleswar and Bhola River it varied between 0.106 mg/L and 0.364 mg/L (Figure 11). 


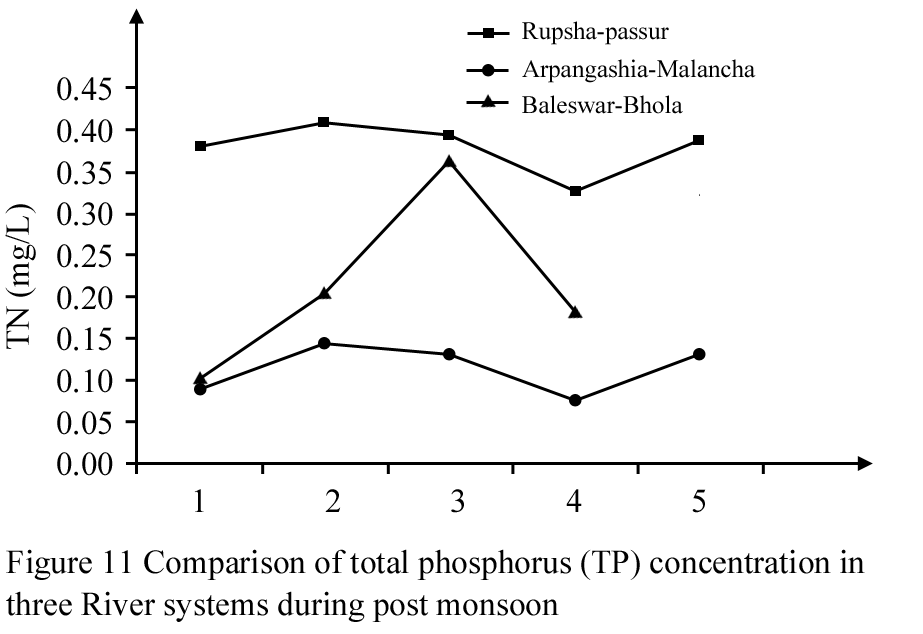
Figure 11 Comparison of total phosphorus (TP) concentration in three River systems during post monsoon


During winter season, TP concentration varied between 0.091 mg/L to 0.371 mg/L in Passur River. In Arpangashia and Malancha River it varied from 0.060 mg/L to 0.113 mg/L and in Baleswar and Bhola River it varied between 0.053 mg/L and 0.144 mg/L (Figure 12). 


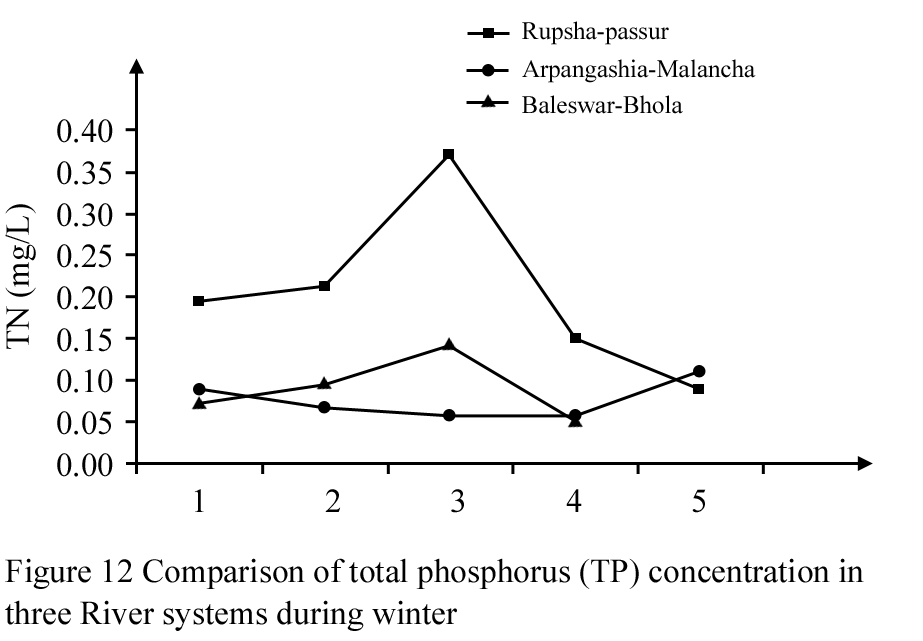
Figure 12 Comparison of total phosphorus (TP) concentration in three River systems during winter


In the mangrove River water Nitrogen and Phosphorus concentration vary considerably. Figure 5 represents that the minimum values (2.31 mg/L) of TN was observed at surface water of Arpangashia River in Post monsoon season. On the other hand the maximum concentration (5.95 mg/L) occurred at surface water of Poshurtola of Malancha River in winter season (Figure 5). Higher concentration of total Nitrogen was found in winter because of less dilution due to reduction of runoff and currents. Seasonal change in the concentration of total Phosphorus varied from the minimum values (0.060 mg/L) was observed at surface water of Kolagachi River Point in winter season to the maximum level (0.409 mg/L) occurred at surface water of Poshurtola of Malancha River in post monsoon (Figure 9).
The higher level of total nitrogen in winter season and higher level of total phosphorus in post monsoon season is in agreement with Adeyemo (2004) who found the nutrient load of water of Ibadan River system during rainy and dry seasons in the range of phosphate (2.23~16.2 ppm and 0.35~2.8 ppm respectively); Total nitrogen (0.13~0.9 ppm and 0.47~3.4 ppm respectively). The high level of nitrogen observed during this study is in agreement with Wolfhard and Reinhard, (1998), who concluded that nitrogen are usually built up during dry seasons. This study is contradictory to the findings of some other study which is given below (Table 2).


Table 2 The contradictory findings of this study and other studies

The phosphorus and Nitrogen concentrations in water were high as compared to the standard (0.2 mg/L) guidelines (EPA, 2002); however Phosphorus concentration was higher during the post monsoon season Figure 6, while Nitrogen was higher during the winter season Figure 5. Land use around Riverine areas in Sundarbans mangrove is predominantly for farmland and could be a possible explanation for the high levels of phosphate from run-off during rainy seasons as observed in this study. There are various sources of phosphorus to Rivers such as, runoff from surface catchments, and interaction between the water and sediment from dead plant and animal remains at the bottom of Rivers. Phosphorus is regarded as the main culprit among the nutrients responsible for eutrophication of River water, as it is the primary initiating factor. The result reveals that the nutrient load in the watershed is high; destruction of the Rivers can therefore result because of nutrient enrichment, productivity, decay and sedimentation (Adeyemo, 2004).

According to Murdoch et al (2001) high Levels of both Phosphorus and Nitrogen can lead to eutrophication, which increases algae growth and ultimately reduces dissolved oxygen levels in the water. In fact, the variations in the chemical composition of natural waters might play an important role in regulating the abundance, composition, the geographical and temporal distribution on phytoplankton (Reynolds, 1984). Excess amount of total phosphorus and total nitrogen, that are discharged into the coastal areas have been shown to cause eutrophication and this would lead to various changes in the algal community structures (Jorgensen and Richardson, 1996). The present study summarizes the spatial and seasonal fluctuations in two major chemical parameters in the water of the Sundarbans mangrove Rivers as exploratory statistical data output which showed that the chemical properties of the mangrove Rivers were significantly affected by freshwater input during monsoon. A significant change in Nitrogen and Phosphorus, were noticed during the present study. The deterioration of water quality and rise in the nutrients level observed in this study is alarming and periodic monitoring and preventative measures are required to save the aquatic system from eutrophication.
Acknowledgments
The authors would like to acknowledge Ministry of Education, Bangladesh for funding to complete this research.
References
Abal E.G., Bunn S.E. and Dennison W.C., 2005, Healthy Waterways Healthy Catchments: Making the Connection in South East Queensland. Moreton Bay Waterways and Catchments Partnership, Brisbane, Australia, pp.240
Adeyemo O.K., 2004, Seasonal Changes in Physico-Chemical Parameters and Nutrient Load of River Sediments in Ibadan City,Nigeria, Global NEST Journal, 10: 323-326
Benjamin L.P., Nina F.C. and Mihael L.P., 1991, Human influence on River nitrogen, Nature 350 (4): 386–387
Chua T. and Bronk D.A., 1997, Dissolved organic nitrogen: a dynamic participant in aquatic ecosystems. Aquatic Microbial Ecology, 31: 279–305
EPA, 2002, National Recommended Water Quality Criteria 2002
Gregory M., David M. and Gertner Z.G., 2001, Nitrate flux in the Mississippi River, Nature 414 (8): 166–167
http://dx.doi.org/10.1038/35102672 PMid:11700544
Hasan M.M., 2001, Water and soil quality of Sundarbans, Paper presented at 1st national conference on the Sundarbans at University of Khulna, 14-16 February, Khulna
Johnston K., 1976, Determination of Nitrite, In: Grasshoff K., Ehrhardt M., and Kremling K., (eds.), Methods of Seawater Analysis, Weinheim, Verlag Chemie, Germany
Johnson J.A., 2000, Water pollution technology. Reston Publishing Co., Reston, VA
Jorgensen B.B. and Richardson K., 1996, Eutrophication in coastal marine ecosystems, Coastal and Estuarine Studies 52. American Geophysical Union, Washington, DCB
http://dx.doi.org/10.1029/CE052
Karim A., 1995, The physical environment, In: Hussain Z., and Akhanya G., (eds), Mangrove of the sunderbans, Bangladesh IUCN, Bankok
Law P.B., Grundman J., Hage D.S. and Carr J.D., 1997, A discussion of water pollution in the US and Mexico with High School laboratory activities for analysis of lead, anthrazine and nitrate, Chemical Education, 74: 1413-1418
http://dx.doi.org/10.1021/ed074p1413
Meybeck M., Helmer, D., 1989, The quality of Rivers: from pristine stage to global pollution. Palaeogeography, Palaeoclimatology and Palaeoecology, 75: 283–309
http://dx.doi.org/10.1016/0031-0182(89)90191-0
Murdoch T., Cheo M., and Laughlin K., 2001, Streamkeeper's Field Guide: Watershed Inventory and Stream Monitoring Methods. Adopt-A-Stream Foundation, Everett, WA. pp.297
Ranjan R.K., Ramanathan A.L. and Singh G., 2008, Evaluation of geochemical impact of tsunami on Pichavaram mangrove ecosystem, southeast coast of India. Environmental Geology, 55:687-697
http://dx.doi.org/10.1007/s00254-007-1019-9
Reynolds, 1984, Phosphorus, nitrogen and organic carbon flux in a headwater stream. Archives of Hydrobiology, 91: 28–44
Turner R.E., Rabalais N.N., Justic D., and Dortch Q., 2003, Global patterns of dissolved N, P and Si in large Rivers, Biogeochemistry, 64: 297–317
http://dx.doi.org/10.1023/A:1024960007569
Wolfhard S., and Reinhard B., 1998, The heterogeneity of runoff and its significance for water quality problems. Hydrological Sciences, 43: 103-113
http://dx.doi.org/10.1080/02626669809492105


Xing G.X., and Zhu Z.L., 2000, An assessment of N loss from agricultural field to the environment in China, Nutrient Cycling in Agroecosystems, 57: 67–73
http://dx.doi.org/10.1023/A:1009717603427

International Journal of Marine Science
• Volume 3
View Options
. PDF(533KB)
. FPDF
. HTML
. Online fPDF
Associated material
. Readers' comments
Other articles by authors
. S.M. Bazlur Rahaman
. Md. Sharif Hasan Sohag
. Alokesh Kumar Ghosh
. Sudhin Kumar Biswas
. Lipton Sarder
. Joyanta Bir
. Shahjahan Siraj Opu
Related articles
. Nutrients
. Post monsoon
. Winter
. Arpangashia
. Baleswar
Tools
. Email to a friend
. Post a comment