Long-term Changes in Sea Surface Temperature at Selected Locations in the Sea of Oman and the Arabian Sea off Oman  

Y.V.B. Sarma1 , Anesh Govender1 , Ebenezer S. Nyadjro2 , Sergey Piontkovski1
1. College of Agricultural and Marine Science, Sultan Qaboos University, P.O. Box.34, Al Khod, P.C. 123, Muscat, Oman
2. NOAA Pacific Marine Environmental Laboratory, 7600 Sandpoint Way NE, Seattle, WA 98115, USA
Author    Correspondence author
International Journal of Marine Science, 2013, Vol. 3, No. 18   doi: 10.5376/ijms.2013.03.0018
Received: 08 Apr., 2013    Accepted: 19 Apr., 2013    Published: 22 Apr., 2013
© 2013 BioPublisher Publishing Platform
This is an open access article published under the terms of the Creative Commons Attribution License, which permits unrestricted use, distribution, and reproduction in any medium, provided the original work is properly cited.
Preferred citation for this article:

Sarma et al., 2013, Long-term Changes in Sea Surface Temperature at Selected Locations in the Sea of Oman and the Arabian Sea off Oman, International Journal of Marine Science, Vol.3, No.18 145-150 (doi: 10.5376/ijms.2013.03.0018)

Abstract

Long-term changes in the sea surface temperature (SST) at two locations off Oman were investigated using Hadley Center SST for the period 1961~2009. A mean annual increase in SST by 0.32℃ was noticed in the Sea of Oman while an increase of 0.53℃ was noticed in the western Arabian Sea. The shift in SST is higher off Muscat than off Masirah during the study period. The bi-modal variability of the SST in the study region is successfully simulated by a cyclic model developed utilizing SST data for 1961~2009 period. An increase in summer warming and decrease in winter cooling are evident in the annual SST distribution at both the locations. The decadal variability off Masirah in the western Arabian Sea showed that the standard deviation of SST switched its character post-1990. The SST variance in Sea of Oman showed a decadal-scale change but in western Arabian Sea, it was nearly unchanged until 1990 and rapidly declined post-1990 period. The large shifts in SST apparently caused higher variability in the sea surface height (SSH) anomalies post-1990 period. 

Keywords
Sea of Oman; Western Arabian Sea; Sea surface temperature; Sea level changes; Long-term SST change

Sea surface temperature (SST) is an important oceanographic variable as it provides the basis for sea level and climate change studies. Regime shifts in SST are noticed worldwide and are characterized by an abrupt transition from one quasi-steady climatic state to another. The transition period being much shorter than the lengths of the individual epochs of each climatic state and tend to impact the other dynamics such as biological processes (Yasunaka and Hanawa, 2002; 2005). The seasonal nature of the SST in the Arabian Sea is bi-modal while in the Sea of Oman, it is unclear, but reported to be largely uni-modal (Colborn, 1971). The Indian Ocean experienced anomalous warming in 1976~1977 indicating an abrupt shift in climate (Nitta and Yamada, 1989; Aoki et al., 2003; Terray and Dominiak, 2005). Khan et al (2004, 2008) reported an increasing trend of SST in the Arabian Sea over the period 1985~1998 and argued that the northern coast of Oman in the Sea of Oman and the east coast of Oman in the northwestern Arabian Sea exhibited different time scales of inter-annual and seasonal variability of the SST. Anomalous and persistent increase in SST during early summer by about 2 off Masirah Island as well as in the Sea of Oman was noticed before the severe cyclones “Gonu” in 2007, and “Phet” in 2010 made landfall along the east coast of Oman (Sarma, 2011).

Long-term trends in SST variability in the Sea of Oman and the northwestern Arabian Sea along Oman are largely under-investigated till date. In this study, we investigated the SST variability at two locations along Oman, which have different warming and cooling patterns. A cyclic model was developed to simulate the bi-modal nature of the seasonal SST changes and the long-term trend in SST at the two selected locations. Further, the SST anomalies (SSTA) at the study locations are compared with sea surface height anomalies (SSHA) to examine the impact of the SST changes on sea level changes at the selected locations.

2 Data and Methods

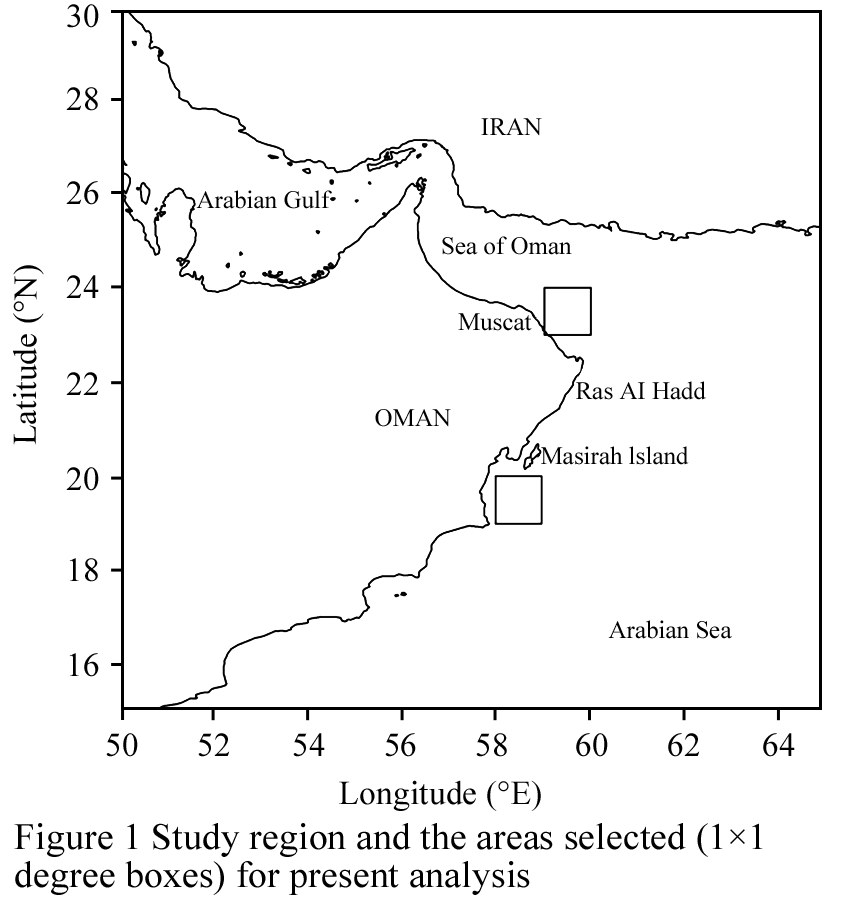
Sea surface temperature (SST) over a one degree-square at two locations; Muscat (23~24°N, 59~60°E) in Sea of Oman and Masirah Island (19~20°N, 58~59°E) in the Arabian Sea (Figure 1) were extracted from the Hadley Center's SST data for the period 1961 to 2009. HadISST1 temperatures are reconstructed using a two-stage reduced-space optimal interpolation procedure, followed by superposition of quality-improved gridded observations onto the reconstructions to restore local detail (Rayner et al., 2003). The SST anomalies (SSTA) are calculated as SST minus mean SST of the entire period (1961~2009).

Figure 1 Study region and the areas selected (1×1 degree boxes) for present analysis 


Monthly average SST for the years 1961 to 2009 was modeled using the following equation and was performed separately for each location:


Where T is the predicted monthly average SST, A
1, P1 and α1 are the amplitude, period and phase shifts, respectively of the first mode and A2, P2 and α2 are the amplitude, period and phase shift of the second mode. The slope and the y-intercept (C) are the linear parameters that describe the trendline of the whole data set. The latter constants were estimated prior to estimating the modal parameters and all parameters were estimated by minimizing the negative log likelihood assuming that the errors were normally distributed with mean zero and variance σ2. The likelihood profile technique (Lebreton et al., 1992) was used for estimating 95% confidence intervals (CI). The slopes of the linear trendlines were tested to determine if they were significantly different from zero (Zar, 1999).
We obtained gridded SSH data from Archiving, Validation, and Interpretation of Satellite Oceanographic data (AVISO, http://www.aviso.oceanobs.com/) for the two locations for the period 1993~2010. This data is an optimal merging of SSH from multiple platforms: Ocean Topography Experiment (TOPEX)/Poseidon, Jason, (European Remote Sensing Satellite) ERS-1/2, and Environmental Satellite (Envisat).
3 Results

The sea surface temperature for the period from 1961 to 2010 gave a mean SST that is significantly higher in Muscat than in Masirah (t-stat0.05, DF=1174=7.48; P=7.5×10⁻¹⁴). Showing interannual and longer time fluctuations in SST (Table 1), SST is noticeably higher post-1985 at Masirah.

Table 1 Statistics of annual SST off Muscat and Masirah during the study period 


The SST anomaly (SSTA) from 1961 to 2009 showed a distinct shift in the SST distribution after 1984 (Figure 2). A quantum jump of about 0.5 is seen in the SSTA post-1984 at both locations. At both locations, there was a positive increase in SST over the period of the study and for both locations the slopes were significantly different from zero (Masirah: t-stat0.05, DF=586=3.88, P=0.0001; Muscat: t-stat0.05, DF=586=2.50, P=0.01). The rate of increase of temperature over the study period was higher in Muscat than Masirah (larger slope value). Muscat shows two prominent peaks with the most prominent one occurring every 12 months while the smaller mode occurring approximately every 6 months (Table 2). The difference between the amplitudes is 0.32 indicating that the two modal peaks are similar in amplitude. The most prominent peak occurs annually during the month of July and the smaller peak during May. In the case for Masirah, though bi-modal in nature it has its prominent peak occurs every 6 months while less prominent peak occurring every 12 months. The amplitude difference between these peaks is 1.48 and shows a large difference in amplitude prominence between them. In Masirah, the prominent peak occurs in the month of November while the less prominent one occurs in the February-March period. Confidence intervals for the P1 parameter could not be estimated for the Masirah location as the maximum likelihood surface for this parameter was flat around the global minimum.


Figure 2 Distribution of SSTA for Muscat (red line) and Masirah (blue line) for the years 1961 to 2010


Table 2 Model parameter estimates and their 95% confidence for the selected locations, Muscat and Masirah


Figure 3 gives the variance estimates of SST grouped in 10-year intervals for the complete fitted models. There are two general trends in the variance, firstly, in Muscat the variance for the 10-year groups is fairly constant for the period 1961~2009 while for Masirah there has been a rapid decrease in variance since 1981~1990. Secondly, between the years 1961 to 1990 variance estimated for the Masirah Island location always exceeded that of Muscat but from 1991 the variance of Muscat has exceeded that of Masirah Island and more noticeably so in the 2001 to 2009 period. The intra-annual distribution of SST variance shows that the low or high variance at the study locations occurs nearly simultaneously (Figure 4). The low variance off Masirah occurred during February-March (0.11) and of high variance is July (0.88). Similarly, lower SST variance (0.11) off Muscat occurred in February and October while higher variance (0.24) occurred in April and August. The SST variance off Masirah is large during summer (June~August) with a peak variance of 0.9 during peak summer period (July) and dramatically reduced to <0.2 during winter. The inter-annual standard deviations and variances have dramatically increased from pre-1984 to post-1984 period at both locations. The monthly mean SST showed significant difference in the pattern of variability between the selected locations as indicated by the slope (0.0115 off Muscat and 0.0225 off Masirah). Table 2 shows the amplitude, period and phase of the SST at the study locations estimated from the model. The amplitude of primary warming is higher off Masirah (2.25) compared to Muscat (1.55).
 

Figure 3 Decadal distribution of variance () of SST at the study locations for the period 1961 to 2009


Figure 4 Monthly distribution of variance () of SST at the study locations for the period 1961 to 2009


The bi-modal model parameter estimates given in Table 2 are utilized to simulate the SST changes at the study locations and the model fits are shown in Figure 5 and Figure 6. The annual and semi-annual changes in the SST were better simulated off Muscat where the standard deviation is relatively smaller. The model simulation shows very small departures from the cooling phase off Masirah in certain years. The impact of long-term warming on sea level was examined by comparing SSTA with SSHA from altimetry for the period 1993 to 2009. The SSHA (Figure 7) exhibited, in general, a continued rising trend between 1993 and 2009 following the similar trend in SSTA. The sea level variability occurred simultaneously in the Sea of Oman and in the western Arabian Sea along the east coast of Oman during the above period. However, the variability is larger in the Sea of Oman compared to the western Arabian Sea. While the sea level was gradually rising, it also exhibited an embedded 6-year cycle of rise and fall in western Arabian Sea off Masirah, but such signal was not clear in Sea of Oman.


Figure 5 Modeled SST (solid line) versus observed SST (dots) off Muscat for the period 1961 to 2009


Figure 6 Modeled SST (solid line) versus observed SST (dots) off Masirah for the period 1961 to 2009


Figure 7 Annual mean SSH anomalies (cm) from altimetry for Muscat (red line) and for Masirah (blue line)


4 Discussion
The SSTA off Muscat and Masirah Island showed evidence for differential heating and cooling patterns during the study period. During summer (April to October), the SSTA off Muscat showed that the SST is about 3 above the annual mean and then drops to approximately 4 below the annual mean during the peak winter (Jan-March). Thus, the SSTA distribution off Muscat showed 6 months of warming phase and 6 months of a cooling phase. In contrast, the Masirah region showed shorter warming and cooling phases with cooling phase off Masirah Island beginning in late December and continues though March. The negative SSTA was about 3 below the annual mean during this period. A short warming phase begins in April and lasts until early June and negative SSTA from mid-June till early September. The second warming phase was observed between October through mid-December. Thus off the Masirah region, the bandwidth of warming/cooling is about 3 months.
This region experienced increased summer warming coupled with reduced winter cooling during the study period. The difference in the mean annual SSTs at Muscat and Masirah showed a clear declining trend with a maximum difference of about 1.13 during the 1960s to a minimum (0.33) in 1991. The SST difference, after 1991, gradually increased and was nearly constant around 0.5 with the Muscat region being warmer. The Sea of Oman, exhibited nearly unimodal SST distribution with only one prominent peak in SST occurring during summer (May-September) and a prominent low in winter (January-March). However, a mild cooling due to local upwelling during August-September interrupted the unimodal character of SST in the Sea of Oman. The SST distribution off Masirah exhibited bi-modal distribution with alternating and shorter warming and cooling periods. Sarma et al (2013) showed that a large shift in the SST regime appeared to have occurred after the 1983~1984 El Nino.
The increase in negative SST anomaly in the western Arabian Sea reduce the southwest monsoon rainfall over India (Shukla, 1975). Izumo et al (2008) made a similar conclusion that increasing SST along Somalia-Oman may result in increased rainfall along India, thus the study of SSTA off Oman has regional significance The El Nino years and La Nina years have good correlation with SST peaks and lows respectively (Sarma et al., 2013), particularly when the ENSO epochs were stronger. The range of intra-annual variance (0.11 to 0.88) noticed off Masirah could be associated with intra-seasonal variability in summer monsoon forcing and the upwelling intensity. The SST off Muscat was always higher and the variability is centered on winter monsoon as well as the meso-scale eddy activity. The long-term (decadal) signal of SST indicated a decline in standard deviation off Masirah while it marginally increased off Muscat. The monthly distribution of variance shows that SST variability off Muscat and off Masirah are impacted different monsoonal forcing viz., southwest and northeast monsoons respectively while the ENSO influence is seen at both locations. The Sea of Oman and the western Arabian Sea off Masirah showed statistically significant increase in mean temperature with higher increase in the Sea of Oman. The variability is fairly constant in Sea of Oman while it is declining off Masirah after 1981~1991. The decadal signal of SST in both areas indicates a regime shift in the SST towards warmer ocean surface. The monthly distribution of variance observed at the study locations showed distinct nature of seasonal forcing that these locations experience during a year. The Muscat region showed low variance (<0.2) during most part of the year except during spring-summer transition (April) and during summer-fall transition (September). During winter (December~March) the SST variance gradually increased in early winter and was lowest during peak winter (0.11) off Muscat.
Large SSH anomalies are associated with increased incidences of harmful algal blooms (HABs) in this region that resulted in fish mortality during post-1990 (Al-Gheilani et al., 2011; Al-Hashmi et al., 2012; Sarma et al., 2013). The changes in SSH anomaly could be due to warming/cooling, seasonal wind variability or meso-scale eddy activity. These processes are capable of inducing the upwelling of nutrients that enhances productivity of the region and causes blooms. The algal blooms during the post-1990s resulted in fish mortality, disruption of desalination plants in Oman (Al-Hashmi et al., 2012; Al-Gheilani et al., 2011). The intense weather systems noticed during this decade (2000~2010) also appear to be the consequence of the increasing in the SST. The influence of El Nino-Southern Oscillation (ENSO) is evident on the distribution of mean annual SSTs of Muscat and Masirah. The El Nino years and La Nina years have strong correlation with SST peaks and lows respectively, particularly when the ENSO epochs are strong (Sarma et al., 2013). The frequency of harmful algal bloom (HAB) events in the Sea of Oman and in the western Arabian Sea, along the east coast of Oman, increased rapidly.(Sarma et al., 2013). The lowest number of HAB events (2) was observed in 1991 gradually increased to six by 1994. Algal blooms increased from two to seven between 1995 and 2002 but a rapid reduction in HAB events was observed until 2004. Between 2006 and 2010, the number of HAB events increased dramatically from three to fourteen. The increase in the frequency of cyclones (Sarma, 2011), harmful algal blooms (Sarma et al., 2013), unseasonal rains (Sarma, 2012) and meso-scale eddies (Piontkovski et al., 2012) during the present decade, 2000~2010, indicates strong influence of a shift in the SST regime in this region.
5 Conclusion
Shifts in SST occurred at different time scales during the study period (1961~2009) at both the study locations. Increased summer heating and reduced winter cooling rendered the upper ocean warmer after 1984 with an average increase in SST of 0.32 off Muscat and 0.53 of Masirah. The Sea of Oman and the western Arabian Sea off Masirah showed statistically significant increase in mean temperature with higher increase in the Sea of Oman. The variability off Mascat is fairly constant while it declined off Masirah after 1984. The decadal signal at both the locations indicated a regime shift in the SST. On inter-annual scale, anomalous increase in SST by 2was noticed for a short period (days to weeks) before intense weather systems such as severe cyclonic storms struck the Oman coast during 2007 and 2010. SSHA variability post-1990s is large and HABs developed when SSH is anomalously low. Increase in the frequency of HABs and intense weather systems noticed during this decade (2000~2010) are apparently associated with SST increase. Regime shift in SST forced several changes in water quality, stratification and biogeochemical character of the seas around Oman resulting in massive alterations to ocean productivity (Sarma et al., 2013; Khalid Al-Hashmi, personal communication). The increase in the frequency of cyclones, harmful algal blooms and meso-scale eddies during the present decade indicates positive response to the SST regime shifts in this region.
Acknowledgments
The altimeter products are produced and freely distributed by SSALTO/DUACS and distributed by AVISO. We are thankful to The Research Council (TRC), Oman for supporting this work through a research Grant No. 50; RC/AGR/FISH/12/01.
References
Al-Gheilani H.M., Matuoka K., Al-Kindi A.Y., Amer S., and Waring C., 2011, Fish kill incidents and harmful algal blooms in Omani waters, Journal of Agriculture and Marine Science, 16: 23-33
Al-Hashmi K., Sarma Y.V.B., Claereboudt M., Al-Azri A.R., Piontkovski S.A., and Al-Habsi H., 2012, Phytoplankton community structure in the Bay of Bandra Khyran, Sea of Oman with special reference to Harmful Algae, International Journal of Marine Science, 2(4): 24-35
http://dx.doi.org/10.5376/ijms.2012.02.0005 
Aoki S., Yoritaka M., and Masuyama A., 2003, Multidecadal warming of subsurface temperature in the Indian sector of the Southern Ocean, Journal of Geophysical Research, 108: 8081
http://dx.doi.org/10.1029/2000JC000307
Colborn J.G., 1971, Thermal Structure Dynamics in the upper 500 meters of the Indian Ocean, Technical Paper NUC TP 266, Naval Undersea Research and Development Center, San Diego, USA, pp.102
Giese B.S., and Ray S., 2011, El Ni-o variability in Simple Ocean Data Assimilation (SODA) 1871-2008, Journal of Geophysical Research, 116: C02024
http://dx.doi.org/10.1029/2010JC006695
Izumo T., Montegut C., Luo J., Behera S.K., Masson S., and Yamagata T., 2008, The role of the westerna Arabian Sea upwelling in Indian monsoon rainfall variability, Journal of Climate, 21: 5603-5623
http://dx.doi.org/10.1175/2008JCLI2158.1
Khan T.M.A., Quadir D.A., Murty T.S, and Sarker M.A., 2004, Seasonal and interannual sea surface temperature variability in the coastal cities of Arabian Sea and Bay of Bengal, Natural Hazards, 31: 549-560
http://dx.doi.org/10.1023/B:NHAZ.0000023367.66009.1d
Khan T.M.A., Khan F.A., and Jilani R., 2008, Sea surface temperature variability along Pakistan coast and its relation to El Nino-Southern Oscillation, Journal of Basic and Applied Sciences, 4: 67-72
Lebreton J.D., Burnham K.P., Clobert J., and Anderson D.R., 1992, Modeling survival and testing biological hypothesis using marked animals: a unified approach with case studies. Ecological Monographs, 62: 67-118
http://dx.doi.org/10.2307/2937171
Nitta T., and Yamada S., 1989, Recent warming of tropical sea surface temperature and its relation to the Northern Hemisphere circulation, Journal of Meteorological Society of Japan, 67: 375-383
Piontkovski S.A., Al-Gheilani H.M.H., Jupp B., Sarma Y.V.B., and Al-Azri A.R., 2012, The relationship between algal blooms, fish kill incidents, and oxygen depletions along the Omani coast, International Journal of Oceans and Oceanography, 6: 145-177
Rayner N.A., Parker D.E., Horton E.B., Folland C.K., Alexander L.V., Rowell D.R., Kent E.C., and Kaplan A., 2003, Global analyses of sea surface temperature, sea ice, and marine air temperature since the late nineteenth century, Journal of Geophysical Research, 108: 4407
http://dx.doi.org/10.1029/2002JD002670
Sarma Y.V.B., 2011, The regime shifts in the sea surface temperature off Oman: Impications to regional climate and marine environment, Proc. Intl. Conf. Effects of Emissions and Effluents on Environment (EEEE-2011), Andhra University, India, 23-24 December, 2011
Sarma Y.V.B., 2012, Long-term changes in sea surface temperature and response of the local weather and marine environment around Oman, Proceedings of 15th Biennial Challenger Conference, University of East Anglia, Norwich, UK, September, 2012, 2-6, 2012 (abstract)
Sarma Y.V.B., Al-Hashmi K., and Smith S.L., 2013, Sea surface warming and its implications for harmful algal blooms off Oman, International Journal of Marine Science, 3(8): 65-71
http://dx.doi.org/10.5376/ijms.2013.03.0008
Shukla J., 1975, Effect of Arabian Sea-surface temperature anomaly on Indian summer monsoon: A numerical experiment with the GFDL model, Journal of the Atmospheric Science, 32: 503-511
http://dx.doi.org/10.1175/1520-0469(1975)032<0503:EOASST>2.0.CO;2
Terray P., and Dominiak S., 2005, Indian Ocean sea surface temperature and El Nino-Southern Oscillation: A new perspective, Journal of Climate, 18: 1351-1368
http://dx.doi.org/10.1175/JCLI3338.1
Wolter K., and Timlin M.S., 1993, Monitoring ENSO in COADS with a seasonally adjusted principal component index, Proc. 17th Climate Diagnostics Workshop, Norman, 12 OK, NOAA/N MC/CAC, NSSL, Oklahoma Climate Survey, CIMMS and the School of Meteor., University of Oklahoma, 52-57
Yasunaka S., and Hanawa K., 2002, Regime Shifts Found in the Northern Hemisphere SST Field, Journal of Meteorological Society of Japan, 80: 119-135
http://dx.doi.org/10.2151/jmsj.80.119
Yasunaka S., and Hanawa K., 2005, Regime shift in the global sea surface temperatures: Its relation to El Nino-Southern Oscillation events and dominant variation modes, International Journal of Climatology, 25: 913-930
http://dx.doi.org/10.1002/joc.1172
 

Zar J.H., 1999, Biostatistical Analysis., Prentice Hall, New Jersey, pp.663

International Journal of Marine Science
• Volume 3
View Options
. PDF(277KB)
. FPDF
. HTML
. Online fPDF
Associated material
. Readers' comments
Other articles by authors
. Y.V.B. Sarma
. Anesh Govender
. Ebenezer S. Nyadjro
. Sergey Piontkovski
Related articles
. Sea of Oman
. Western Arabian Sea
. Sea surface temperature
. Sea level changes
. Long-term SST change
Tools
. Email to a friend
. Post a comment