Research Article
Profit Efficiency and Profit Progress among Small Scale Fish Farmers in Niger State, Nigeria: MLE Econometric Profit Frontier Function Approach 
2 Department of Agricultural Economics and Extension, Bayero University Kano, Nigeria
3 Department of Agricultural Economics, UAS, Dharwad, India
4 Department of Agricultural Economics, PJSTSU, Hyderabad, India
5 Department of Agricultural Economics, Bayero University Kano, Nigeria
6 Department of Agricultural Economics and Extension, Federal University of Technology, Minna, Nigeria
 Author
  Correspondence author
International Journal of Aquaculture, 2015, Vol. 5, No. 45 doi: 10.5376/ija.2015.05.0045
Received: 13 Nov., 2015 Accepted: 25 Dec., 2015 Published: 11 Mar., 2016
Sadiq M.S., Singh I.P., Suleiman A., Isah M.A., Umar M.S., Maude M.A., Lawal A.T., and Sallawu H., 2015, Profit efficiency and Profit Progress among Small Scale Fish Farmers’ in Niger State, Nigeria: MLE Econometric Profit Frontier Function, 5(45): 1-12 (doi: 10.5376/ija.2015.05.0045)
Self-sufficiency in fish production has been an issue in Nigeria given the quantum of high demand and high expenditure incurred in importation of this product which directly contributes to devaluation of the country currency which in extension impaired the economy status (development and growth) in the country. The best option and the most effective way to improve productivity and sustainability is through efficient utilization of the scarce resources keeping in view cost content at the disposal of these producers, most especially the small-scale producers who account for the bulk of total output in the country. In an attempt to map out a sustainable pathway, this paper empirically study the profit efficiency of small-scale fish farmers′ in Niger State, Nigeria using maximum likelihood estimation (MLE) econometric profit frontier function approach keeping in view the pre-requisite components of economic efficiencies-technical, allocative and scale efficiencies. Multi-stage sampling technique was employed to select 109 current and active fish farmers drawn from the total sampling frame of 182 active producers′ obtained from Niger State Ministry of Livestocks and Fisheries Development viz. three LGAs' namely, Bida, Chanchaga and Borgu. Pre-tested questionnaire coupled with interview schedule were the primary instruments used to elicit information from the respondents in the study area during the 2014 production cycle. Descriptive statistics and MLE stochastic profit frontier were used to achieve the objectives of this study. Empirical results reveals a mean profit efficiency score of 0.69; with 0.21 profit efficiency score gap or profit lost which was attributed to combination of technical, allocative and scale inefficiencies. Furthermore, an average profit-loss estimated was N 8500. Factors related to profit-loss and profit inefficiency are illiteracy, inadequate functional infrastructural facilities, zero training, zero extension advisory services and poor market for these products. Therefore the study recommends improvement in those factors that affects profit efficiency so that they can avail themselves the opportunities to optimize profit efficiently, thus, enhancing their livelihood status and sustainability of this sector, which in the long run will impact positively on the economy of the country. Furthermore, the study opined that improvement in efficiency should be an inclusive responsibility, viz. individual farmers, relevant stakeholders, Non-governmental organizations, research institutions and government both at local, state and federal level respectively.
1 Introduction
The practice of fish cultivation has been in existence since ancient civilization days of Egypt and China; fish culture in Egypt (Africa) date back 2000BC, and began as hobby by fisheries expatriate officers in Nigeria in year 1942 (Olayiwola, 2013). Fish farming is often cited as one of the means of efficiently increasing production of food in deficit countries (Onoja and Achike, 2011; Williams et al., 2012), and Nigeria inclusive, has the potential to be self-sufficient in fish production, both for households’, industrial needs and also for export (Olayiwola, 2013). But the production outlook is worrisome given the growing demand for fish food and the declining yield of natural fish stocks which is attributed to over-exploitation (Onoja and Achike, 2011). However, natural fish stocks still holds the greatest potentials to rapidly boost domestic animal protein supply in Nigeria (Itam et al., 2014).
Decline in domestic production of fish in the post Structural Adjustment Programme (SAP) era has been attributed to policy measures adopted under SAP, which had brought about an increase in the cost of inputs. However, other constraints militating against concerted production effort have been identified by fish farmers. Over the years, several governments and individual fish farms were established, some were successful while others failed due to poor managerial basic principles guiding profit oriented fish farming venture. Even despite effort by National Accelerated fish Production Project (NAFP) in Nigeria toward improving the efficiency of fish farmers as well as increasing per capital income of indigenous fish farmers, the resultant outcomes were below expectation due to poor project implementation, monitoring and evaluation.
Addressing these obstacles is an important step toward attaining self-sufficiency in fish production especially for low income earners majority of who mainly consume protein from fish sources. Furthermore, most recent studies on this subsector failed to critically examine the importance of the different fish culture systems with a view to ascertain the most economically viable method. If fish culture is to play a vital role in ensuring future fish availability for food security in the country, this sector has to develop and expand in an economically viable and environmentally sustainable manner. Among many other factors, increasing efficiency of resource use and productivity at the farm level is one of the pre-requisites for sustainable fish culture. Existing low level of productivity in fish production reflect low level of technical and economic efficiencies. Therefore, improving the performance of fish sub sector is an indication of good growth in fish production process which is linked to farm profit. Hence, productivity and efficiency is no longer debatable but a necessity in view of imminent deficit experienced in the country judged by its over dependence on fish importation in recent time.
The embargo on the importation of fish and other food stuff that can be produced locally in the country is an indication that fish farmers in the country must leave up to the expectation of meeting the local demand. Presently, fish culture has spread to all states in the country, because it is seen as the best alternative to bridge the widening gap that exist between the demand and supply of fish food in Nigeria (Itam et al., 2014); a sure means of substantially solving the demand-supply gap is by embarking on widespread homestead/small scale fish production, because the industry remains the most virgin investment in Nigeria when compared with the importation of frozen fish in the domestic market. A potent way to achieve this is to devise appropriate capacity building mechanism for these homestead/small-scale fish farmers who accounts for bulk fish production in Nigeria using profit efficiency that is based on competitive market so that their efficiency level will be increased. Though, the present study selected Niger State as a case study given its environmental and institutional suitability for fish culture, e.g the presence of Fisheries Research Institute (NIFFR) in New-Bussa.
Computing profit efficiency therefore, constitutes a more important source of information for policy makers than the partial vision offered by cost efficiency. Estimation of profit frontier function capture firm level production specialization, thus allowing the higher revenues reserved by the firms that produce differentiated or higher quality output to compensate for the higher cost incurred. However, in Nigeria considerable efforts have been made in examining efficiency of fish farmers but exclusively focused on technical efficiency (Kareem et al., 2011; Onoja and Achike, 2011; Olayiwola, 2013; Itam et al., 2014), without any recluse to measuring profit efficiency of fish farmers even when the prices of output and input are known. The physical productivity consideration (Technical efficiency) is important improvement in production efficiency, but profit efficiency will lead to greater benefits to fish producer in the country.
Therefore, the objective of this paper was to empirically test profit efficiency of small scale fish farmers in Niger State, Nigeria using MLE stochastic profit frontier approach to measure the relative performance of the firms by objectively providing a numerical efficiency values and ranking them accordingly, thus, revealing how close farmers are to the “best-practiced” frontier, and such analysis will be significant in providing information that is useful in policy making both at micro and macro level. In addition, the paper investigated profit efficiency determinants in small scale fish production in the state.
Hypotheses
H0: Absence of profit inefficiency
H1: Presence of profit inefficiency
2 Theoretical Framework of Stochastic Profit Frontier
Profit efficiency is defined as the ability of a farm to achieve the highest possible profit, given the prices and the levels of fixed factors (Ali and Flinn, 1989). Farm specific profit frontier is obtained with interaction between farm specific prices and levels of fixed factors. Profit inefficiency is defined by the proportion by which farm’s operation deviate from the profit frontier given the prices and resource endowments. Profit efficiency is a broader concept than cost efficiency since it takes into account the effects of the choice of a certain factor of production both on costs and on revenues. Given the input and output prices a farm maximizes profits by adjusting the amounts of inputs and outputs.
This can be specified as:

Where, πi is the normalized profit for ith farm obtained as profit divided by the price of output. pi, represents price of ith variable inputs divided by output price and zi is the fixed factor used by ith farm. The error term is composed of two components:
.png)
Where vi is normal, independently and identically distributed [i.e., vi~N (0, δ2v] two sided error term representing various random shocks and effects of measurement error of variables. The other component ui; is the non-negative or one-sided residual representing farm-specific profit inefficiency. Hence if ui=0, the farm’s profit inefficiency is nonexistent, i.e., the farm makes maximum possible profit (being on the frontier) given its input prices and fixed factors. Conversely, ui >0 indicates that the farm forgoes profit due to inefficiency (Ali and Flinn, 1989). Therefore, economic efficiency of an individual farmer is derived in terms of the ratio of the observed profit to the corresponding frontier profit given the price of variable inputs and the level of fixed factors of production of farmers.
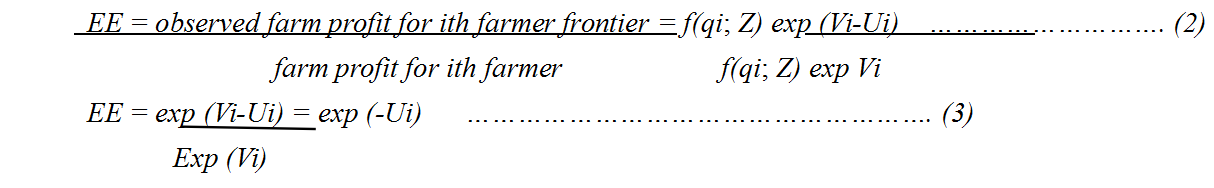
The profit efficiency is expressed as the ratio of predicted actual profit to the predicted maximum profit for a best-practiced farmer and this is represented as follows:

Firms specific profit efficiency is again the mean of the conditional distribution of Ui given by Eπ and is defined as:

E π takes the value between 0 and 1. If Ui=0 i.e. on the frontier, obtaining potential maximum profit given the price it faces and the level of fixed factors. If Ui > 0; the farm is inefficient and losses profit as a result of inefficiency.
3 Research Methodology
The study area is Niger State, Nigeria. The State is located in North-central Nigeria between Latitudes 8°20′ N and 11°30′ N and Longitudes 3°30′ E and 7°20′ E with a total land area of 76,363 square kilometres and an estimated population of about 4,082,558 people. Annual rainfall ranges between 1100mm and 1600mm with average monthly temperature hovering around 23°C to 37°C (Sadiq, 2014). The range of local climatic and soil conditions, resource availability, and markets allows favourable fish farming practices. Multi stage sampling techniques was used for the study. Primary data were elicited during 2014 production season vis-à-vis administration of pre-tested questionnaire coupled with interview schedule to active small-scale/homestead fish farmers from three Local Government Areas (LGAs), purposively selected due to preponderance of small-scale fish culture activities, viz Bida (Zone I), Chanchaga (Zone II) and Borgu (Zone III), one each from the three Agricultural zones in the state. Sampling frame of 182 active fish farmers was obtained from Niger State Ministry of Livestock and Fisheries Development out of which 109 (60%) respondents were selected as representative sampling size for the study (Table 1). Information were collected on input and output keeping in view the cost involved in carrying out each operation. Major analytical technique used for data analysis was stochastic profit frontier model.
.png) Table 1 Sampling frame of catfish farmers in Niger state, Nigeria Note: Source: NSMLFD, 2014 |
Empirical model
Profit efficiency is defined as profit gain from operating on the profit frontier, taking into consideration farm-specific prices and factors. And, considering a farm that maximizes profit subject to perfectly competitive input and output markets and a singular output technology that is quasi-concave in the (n x 1) vector of variable inputs, and the (m x 1) vector of fixed factors. The actual normalized profit function which is assumed to be well behaved can be derived as follows;
Farm profit is measured in term of Gross Margin (GM) which equals the difference between the Total Revenue (TR) and Total Variable Cost (TVC). That is:

To normalize the profit function, gross margin (π) is divided on both sides of the equation above by Py which is the market price of the output. That is:

Where:
TR = Total revenue (Naira);
TVC = Total variable cost (Naira);
Py = Unit price of output (Naira/kg);
Xi = Variable input quantity (kg);
Z = Price of fixed inputs (Naira);
Pi = W/Py which represents normalized price of input Xi,
While f (Xi, Z) represents production function. The Cobb-Douglas profit function in implicit form which specifies production efficiency of the farmers is expressed as follows:
πi = πi /Py = f (Xi, Z) exp (Vi – Ui) ..................................................................(8)
Where:
π = normalized profit of ith farmer (Naira);
Xi = vector of variable inputs (Naira);
Z = vector of fixed inputs (Naira);
Py = unit price of output (Naira); and,
exp (Vi - Ui) = composite error term
However, for this study, Coelli (1996) model was used to specify the stochastic frontier function with behaviour inefficiency components and to estimate all parameters together in one step maximum likelihood estimation. The explicit Cobb-Douglas functional form for the fish farmers in the study area, is therefore, specified as follows:
Inπ = α0 + α1InP1i + α2InP2i + α3InP3i+ α4InP4i + α5InP5i + α6InP6i + α7InX1i + α8InX2i + (Vi – Ui) ........ (9)
Where:
π = Restricted normalized profit computed for jth farm which is defined as gross revenue less variable costs divided by farm specific fish output price Py;
ln = Natural log
Pi = Price of variable inputs normalized by price of output ( i =1, 2, 3 and 4),
So that:
P1= Costs of labour normalized by unit price of fish output (Py)
P2 = Costs of fingerlings normalized by unit price of fish output (Py)
P3 = Costs of fertilizer normalized by unit price of fish output (Py)
P4 = Costs of feeds normalized by unit price of fish output (Py)
P5 = Costs of medications normalized by unit price of fish output (Py)
P6 = Costs of lime normalized by unit price of fish output (Py)
Xi = Quantity of fixed inputs ( i = 1, 2)
Where,
X1= Pond size (hectares) for each farm jth
X2 = Depreciation on capital used in farm jth
α0 = Constant parameter
α1-n = Coefficients of parameters to be estimated
The inefficiency model (Ui) is defined by:
Ui = δ0 + δ1Z1i + δ2Z2i + δ3Z3i + δ4Z4i + δ5Z5i + δ6Z6i + δ7Z7i + ϑ ......................................................... (10)
Where;
Ui = Inefficiency effects;
Zi = Variables explaining inefficiency effects and are defined as follows;
Z1 = Education (Formal =1, otherwise= 0);
Z2 = Household size (numbers);
Z3 = Experience (years);
Z4= Infrastructural facilities (Adequate functional =1, otherwise = 0);
Z5= Training (yes=1, otherwise= 0);
Z6 = Extension advisory services (yes= 1, otherwise= 0); and,
Z7 = Adequate market (yes= 1, otherwise= 0);
ϑ = Truncated random variable;
δ0 and δ1-n are scalar parameters to be estimated.
These socio-economic variables are included in the model to indicate their possible influence on the profit efficiencies of the fish farmers (determinant of profit efficiency).
Profit loss due to inefficiency was calculated as maximum profit at farm- specific prices and fixed factors multiplied by farm- specific profit inefficiency. Profit loss is defined as the amount that has been loss due to inefficiency in production given the prices and fixed factor endowments, and is calculated by multiplying maximum profit by (1-Pe). Maximum profit per hectare is computed by dividing the actual profit per hectare of individual farms by its efficiency score.
PL = maximum profit (1-PE) ............................................................ (11)
Where:
PL = profit loss
PE = profit efficiency
4 Results and Discussion
4.1 Summary statistics of the variables in stochastic profit frontier (per farm per production cycle)
Table 2 shows the summary statistics of the variables included in the profit frontier. The mean yield of 753 kg per farm in one production cycle was recorded over the sampled farm with a standard deviation of 214 kg, and an average output price of N 350 per kg in the sampled area. The result further revealed a mean profit margin of N 160,305.50 per farm per production cycle with standard deviation of N 43,416.00. The average level of education of the farmers was 14 years with an approximately 5 years of fish farming experience, and an average household size of 5 persons.
.png) Table 2 Summary statistics of the variables in stochastic profit frontier model (per farm per production cycle) Note: Source: Field survey, 2014 |
4.2 Maximum likelihood estimates of stochastic profit frontier
The maximum likelihood estimates (MLE) of the parameters of the stochastic profit frontier model is presented in Table 3a. The dependent variable was restricted normalized profit from an output of one production cycle. The estimated Sigma-Squared (σ2) was 0.575 and statistically significant at 1 percent probability level. Since the figure is significantly different from zero, it indicates correctness and good fit of the specified distributional assumption of the composite error term. The estimated gamma parameter (γ) of 0.488 was significant at 5 percent probability level. This implies that 48.8 percent variation in actual profit from maximum profit (profit frontier) between farms mainly arose due to differences in farms’ practices rather than random variability. Gamma (γ) is the ratio of errors and is bounded between 0 and 1; when = 0, inefficiency effects are absent, when > 0, inefficiency effects exists, and when = 1, inefficiency effects are highly significant in the analysis (Battese and Coelli, 1995). Since inefficiency effects make significant contribution to the profit inefficiencies of fish farmers, the hypothesis which specifies that inefficiency effects are absent from the model is strongly rejected. Therefore, profit can be optimized if the inefficiency effects among farmers are minimized. Furthermore, the result of the generalised likelihood ratio which is defined by the chi square distribution reveals that the χcal is greater than the χtab, as such the null hypothesis which specifies that the inefficiency effects in the stochastic profit frontier are not stochastic is also rejected (Table 3b), thus, proving that the traditional response function (OLS) is not an adequate representation for the data.
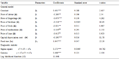 Table 3a Maximum likelihood estimates (MLE) of the Cobb-Douglas stochastic profit frontier Note: Source: Computer print-out of FRONTIER 4.1 |
 Table 3b Generalized likelihood ratio test of hypothesis for parameters of the stochastic profit frontier Note: Source: Computed from MLE Results |
All the coefficients of the estimated parameters of the normalized profit function are based on the assumption that competitive markets carry the theoretically expected signs in the MLE model and are statistically significant, except lime and medication prices respectively, which were not significant and the reason might be due to its lesser contribution to the profit of fish production. This implies that all the variables included in the model are influential variables in fish production. Furthermore, a unit increase in the price of inputs with positive coefficient will lead to an increase in the normalized profit of fish and vice versa. The estimated coefficients reveals that wages, fingerlings price, feeds price, fertilizer price, depreciation on capital and pond size significantly affected the farm level profit of fish producers in the study area. The coefficient of wages (-0.27), fingerling price (-0.68), feeds price (-0.02), fertilizer price (-0.22) and capital depreciation (-0.19) has negative and significant relationship with farm profit, while medication and lime prices, respectively, were non-significant and also inversely related to the farm profit. Therefore it can be inferred that, N 1 increase in these factor prices will bring about a marginal decrease in farm profit by N 0.27, N 0.68, N 0.02, N 0.22, N 0.01 and N 0.19 respectively. In other words 1 percent increase in each factor prices will results in marginal percentage decrease in farm profit by -0.27, -0.68, -0.02, -0.22, -0.01 and -0.019 respectively, given that the coefficients are inversely related to the farm profit margin. Pond size affects profit efficiency positively with slope coefficient of (1.047), which implies that 1hectare increase in pond size will increase the profit margin by 104.7%.
4.3 Factors explaining inefficiency and determinants of profit-loss
For policy purposes, it is very useful to identify the sources of these inefficiencies which can be done by investigating the relationship between farmer characteristics and the computed profit inefficiency. The result of the inefficiency is presented in Table 4a. These variables are expected to explain the determinants of profit efficiency in fish production among fish farmers in the study area and their signs are very important in explaining the observed level of profit efficiency of the farmers. A coefficient with negative sign implies that the variable had an effect in decreasing profit inefficiency, while a positive coefficient signifies the effect of increasing inefficiency. Table 4b explains the profit-loss in statistically significant variables due to inefficiency. Statistically significant variables in relation to profit efficiency are availability of market, education, extension services, functional infrastructural facilities and training.
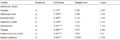 Table 4a MLE for determinants of profit inefficiency in small-scale fish farming Note: Source: Computer print-out of FRONTIER 4.1 |
.png) Table 4b Key parameters explaining inefficiency and profit loss per hectare Note: Source: Computed from computer print-out of FRONTIER 4.1 P.E.S:- Profit efficiency score EAS:- Extension advisory services |
A negative relationship and statistically significant (P<0.10) effect between inefficiencies and education implies that farmers with formal education incur less profit-loss and operate at significantly higher level of profit efficiency. Research has proved that farmers with formal education tend to adopt new technologies rapidly and use them effectively to enhance their productivity. Therefore, inefficiencies among farmers can be reduced if farmers acquired formal education.
Infrastructure facilities viz adequate water supply and electricity was highly significant (P< 0.01) and has negative relationship on profit inefficiencies in fish farming which conforms to the apriori expectation. Farmers who have access to adequate water supply and electricity performs significantly better in terms of earning actual profit per hectare, hence, incurring less profit-loss and operating at higher levels of efficiency as shown in Table 4b. The importance of good infrastructure for agricultural development is widely recognized, and insufficient of infrastructure is one of the key bottlenecks to agricultural development, because where functional adequate infrastructural facilities are provided, economic returns on input use is always high. Several econometric studies have estimated the effects of infrastructural investment on agricultural output and productivity with results of most of these studies showing a positive and significant effect (Fan and Zhang, 2004).
Training coefficient was found to have negative and statistically significant (P<0.01) relation with profit inefficiency (Table 4a). This means that farmers who have attended training are profit efficient, while farmers who do not have training are inefficient, and thus subjected to low profit efficiency. And interestingly, farmers with training incur less profit-loss (Table 4b) as these farmers’ participated in the ‘homestead aquaculture management course and were given basic training on fish production.
The estimated coefficient associated with the extension advisory services (EAS) has negative and significant (P<0.01) relationship with profit inefficiency (Table 4a). This implies that farmers who have access to extension services perform significantly better in operating at higher level of profit efficiency and incur less profit loss (Table 4b) as compared to their counterparts with no contact. Extension through advisory services and programmes forges to strengthen the farmers’ capacity to develop by providing access to agricultural information, thus, contributing to improvement in fish culture development and enhance good living condition of farmers. Fish research will remain largely academic unless extension workers provide input in terms of the identified and as-yet unsolved field problems of the farmers.
The estimated coefficient associated with marketing has negative and significant (P<0.10) relationship with profit inefficiency (Table 4a). This means that farmers with good marketing channel tends to be more profit efficient and incur less profit loss in the business as shown in Table 4b. Moreover, marketing plays a coordinating role, steering supply and demand with respect to place, time and form utilities. A properly functioning market (such as pricing system) for fish products is generally perceived as the best organizational structure to achieve more efficient production, in terms of type, quantity, quality and consumption decisions. Efficient, integrated and responsive market mechanism is of critical importance for allocative efficiency and stimulating farmers to increase their profit efficiency. The remaining variables; experience and household size exert no significant effects, therefore need no further discussion.
4.4 Profit efficiency score and profit-loss among fish farmers in Niger State, Nigeria
Table 5a shows the frequency and efficiency score distributions of profit efficiency of fish farmers in Niger State, Nigeria. The result reveals that the profit efficiency score levels of the farmers ranges from 15 percent to 86 percent, with a mean profit efficiency of 69 percent. This implies that fish farmers in the study area are relatively profit efficient, and it is clear that there exist opportunities to increase their profit efficiency level by an average of 31 percent through improvement in their technical, allocative and scale efficiencies. The ‘best’ practice farmer operated at 86 percent profit efficiency level; while the ‘least’ practice farmers were found to operate at 15 percent profit efficiency level. This indicates that, there is room for improvement for low profit efficient farmers to achieve maximum efficiency like their most efficient counterparts if determinants of inefficiency are minimized. However, the least profit efficient farmer needs profit efficiency gain of 82.6% [(1.00 – 0.15/0.86)*100] in the use of specified farm resources if such farmer is to attain the profit efficiency of the best farmer in the study area; and profit efficiency gain of 85% [(1.00-0.15/1.00)*100] to be on the frontier. Likewise for an average efficient farmer, he requires profit efficiency gain of about 19.8% [(1.00 – 0.69/0.86)*100] to attain the status of the most profit efficient farmer; and 31% [(1.00 – 0.69/1.00)*100] profit gain to be on the frontier. Also, the most profit efficient farmer requires profit efficiency gain of 14% [(1.00-0.86/1.00)*100]to be on the frontier. Furthermore, from the result obtained, an approximately 59.6 percent of the farmers’ were close to the frontier with profit efficiencies score of 69 percent and above. Therefore, it can be inferred that despite the variations in efficiency scores, majority of the farmers seemed to be skewed towards the efficiency level of 0.69 and above. Graphically it is depicted in figure 1.
.png) Figure 1 Frequency distribution of profit efficiency score |
 Table 5a Frequency distribution of profit efficiency score Note: Source: Computed from computer print-out of FRONTIER 4.1 |
The frequency and percentage distribution of the loss in profit is shown in Table 5b. Profit loss is defined as the amount of the profit that was loss due to inefficiency in production, given the prices and fixed factor endowments. The results reveals that the average profit-loss among fish farmers in the study area was N 8500 per hectare which could be minimized by improving technical, allocative and scale efficiencies. Fish farmers in the study area exhibited wide range of profit loss, where the maximum farm-specific profit loss was N 22000 and the least was N 3200. This clearly indicates and point to the fact that opportunities exist to increase profit levels among fish producers in the study area, given the prevailing technology, prices, and levels of fixed factors. However, an estimated 21.1 percent of fish farmers in the study area incur an estimated profit-loss of more than N 10000, thus, indicates that an estimated 78.9 percent of the farmers incurred an estimated profit-loss of less than N 10000, an indication that the farmers to certain extent tried to minimize their profit-loss. This is graphically depicted in figure 2.
5 Conclusion and Recommendations
This research used stochastic Cobb-Douglas profit frontier approach to determine profit efficiency among small scale fish farmers in Niger State of Nigeria using farm level survey data obtained from 109 fish farmers. The study revealed a wide variation of profit efficiency scores which ranged from 15 percent to 86 percent with mean efficiency of 69 percent. This wide variation may be due to low output prices and the imperfect condition of input markets in the study area. The mean efficiency level indicates that there exists room for more profit gain by improving the technical, allocative and scale efficiencies. Factors that have significant effects on profit efficiency are education, functional infrastructural facilities, training, extension advisory services and adequate market. The policy implication of these finding is that inefficiency in small-scale fish production can be reduced significantly by improving/enhancing the level of training (skill acquisition), infrastructural facilities among the farmers and extension service delivery. Of paramount importance are good market and the existing technological packages that need to be critically and thoroughly examine. In addition, to improve economic efficiency in resource use, access to current technical and price information is important to the farmers and relevant stakeholder should introduce relevant policies to support farmers in this direction. Farmers should be advice and encourage to adopt cost effective measures in order to earn better returns.
 Figure 2 Frequency distribution of profit loss |
 Table 5b Frequency distribution of profit loss |
Ali, M., and Flinn, J.C., 1989, Profit efficiency among basmati rice producers in Pakistan, Punjab, American Journal of Agricultural Economics, 71(2): 303 -310
http://dx.doi.org/10.2307/1241587
Battese, G.E., and Coelli, T.J., 1995, A model for technical inefficiency effects in a stochastic frontier production function for panel data, Empirical Economics, 20(2): 325-332
http://dx.doi.org/10.1007/BF01205442
Coelli, T.J., 1996, A guide to frontier version 4.1c: A Computer Programme for Stochastic Frontier Production and Cost Function Estimation, CEPA Working Paper 96/08 Mines, Dept. of Econometrics, Armidele, Australia: University of New England, Fan, S., and Zhang, X., 2004, Infrastructure and regional economic development in Rural China, China, Economic Review, 15: 203-214
Itam, K.O., Etuk, E.K., and Ukpong, I.G., 2014, Analysis of resource use efficiency among small-scale fish farms in Cross River State, Nigeria, International Journal of Fisheries and Aquaculture, 6(7): 80-86
http://dx.doi.org/10.5897/IJFA2013.0404
Kareem, R.O., Dipeolu, A.O., Aromolaran, A.B., and Akegbejo-Samson, 2008, .Analysis of technical, allocative and economic efficiency of different pond systems in Ogun State, Nigeria, African Journal of Agricultural Research, 3(4): 246-254
Sadiq, M.S., 2014b, Profitability of small scale fish farming in Minna Agricultural Zone of Niger State in Nigeria, Indian Journal of Economics and Development, 10(4): 382-386
http://dx.doi.org/10.5958/2322-0430.2014.00561.7
Olayiwola, O.O., 2013,Technical efficiency of fish production in Ijebu-Ode Local Government Area of Ogun State, International Monthly Refereed Journal of Research In Management and Technology, II: 26-42
Onoja, A.O., and Achike, A.I., 2011, Resource productivity in small-scale catfish (Clarias Gariepinus) farming in Rivers State, Nigeria: A Translog Model, Approach Journal of Agriculture and Social Research, 11(2): 139-146
Williams, S.B., Kareem, R.O., and Ojolowo, O.A., 2012, Economic analysis of catfish production in Ile-Ife, Osun State, Nigeria, Journal of Human Ecology, 40(1): 1-7


. PDF(291KB)
. HTML
Associated material
. Readers' comments
Other articles by authors
. M.S. Sadiq
. I.P. Singh
. A. Suleiman
. M.A. Isah
. M.S. Umar
. M.A. Maude
. A.T. Lawal
. H. Sallawu
Related articles
. Fish
. Profit efficiency
. Frontier
. Farmers
. Small-scale
. Niger State
. Nigeria
Tools
. Email to a friend
. Post a comment